
FIGURE
Figure 1
- ID
- ZDB-FIG-240429-16
- Publication
- Zhou et al., 2024 - Mapping the Metabolic Characteristics and Perturbation of Adult Casper Zebrafish by Ambient Mass Spectrometry Imaging
- Other Figures
- All Figure Page
- Back to All Figure Page
Figure 1
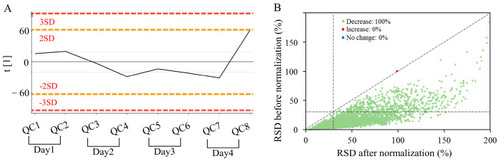
Results of data quality control and normalization obtained by (+) AFADESI-MSI. ( |
Expression Data
Expression Detail
Antibody Labeling
Phenotype Data
Phenotype Detail
Acknowledgments
This image is the copyrighted work of the attributed author or publisher, and
ZFIN has permission only to display this image to its users.
Additional permissions should be obtained from the applicable author or publisher of the image.
Full text @ Metabolites