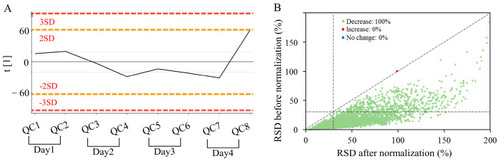
Results of data quality control and normalization obtained by (+) AFADESI-MSI. (A) Line plot of QC samples generated by using PCA with one component. (B) Comparison plot of the data RSD of QC samples before and after normalization based on SVR. The dashed lines on the x- and y-axis indicate the limit of RSD = 30%.

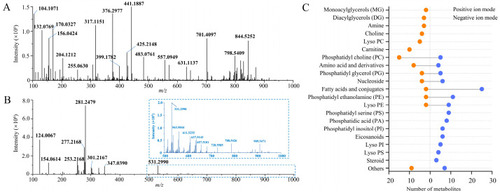
Spatial metabolome of whole-body casper zebrafish obtained by AFADESI-MSI. (A) Representative mass spectra in positive-ion mode; (B) representative mass spectra in negative-ion mode; (C) number of identified or annotated metabolites of different structural categories.

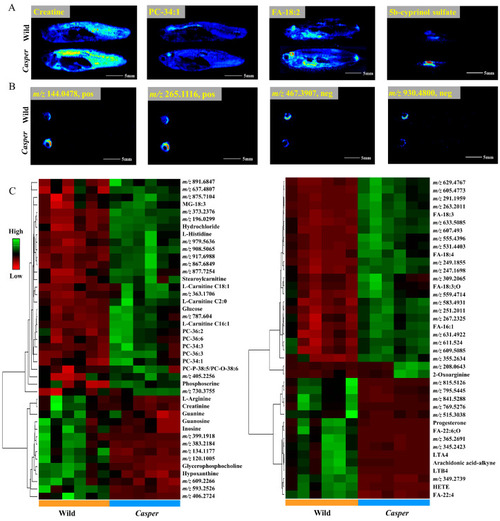
Spatial metabolome differentials between casper and wild-type zebrafish obtained by AFADESI-MSI. (A) MS images of representative endogenous metabolites; (B) MS images of ions distributed specifically in eyes; (C) cluster heatmaps of differential variables using (±) AFADESI-MSI data.

AFADESI-MSI comparison and statistical analysis results of differential metabolites in altered pathways. (A) Four metabolites in purine metabolism; (B) three metabolites in ARA metabolism.

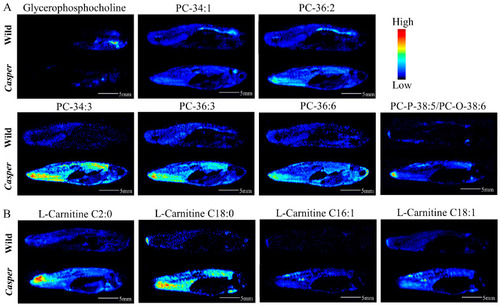
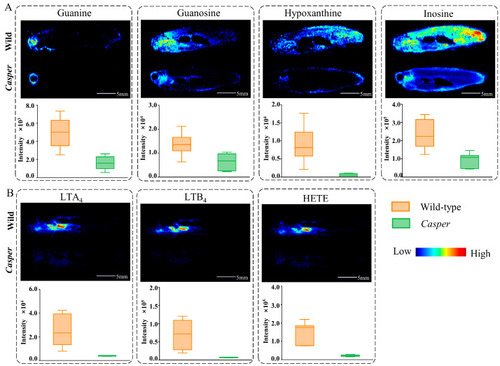
AFADESI-MSI comparison of differential metabolites between casper and wild-type zebrafish. (A) MS images of seven glycerol PCs; (B) MS images of four carnitines.

Metabolic disorder in casper zebrafish compared with wild-type zebrafish. The green box represents upregulation of metabolites, the purple box represents downregulation of metabolites; the depth of the color is related to the value of FC, and the darker the color, the larger the FC, which divided into FC > 2, FC > 5, and FC > 10.

Acknowledgments
This image is the copyrighted work of the attributed author or publisher, and ZFIN has permission only to display this image to its users. Additional permissions should be obtained from the applicable author or publisher of the image. Full text @ Metabolites