|
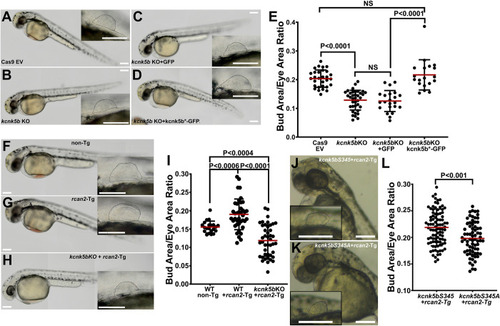
Rcan2-mediated decrease in intracellular K+ involves Kcnk5b. (A–D) Representative 48 hpf embryos and enlarged panels of fin buds of control Cas9 and empty sgRNA vector (EV) embryo (A), CRISPR-targeted kcnk5b embryo (B), CRISPR-targeted kcnk5b embryo overexpressing GFP (C), CRISPR-targeted kcnk5b embryo overexpressing kcnk5b*-GFP that harbors altered wobble bases to impair interaction with targeting sgRNA (D). (E) Fin bud-to-eye area ratios of the indicated genotypes. (F–I) Representative 48 hpf embryos and enlarged panels of fin buds of control Cas9 and empty sgRNA vector (EV) non-Tg embryo (F), rcan2-mCherry-expressing embryo and enlarged panel of the fin bud (G) CRISPR-targeted kcnk5b embryo overexpressing rcan2-mCherry (H). (I) Fin bud-to-eye area ratios of the indicated genotypes. (J, K) Representative 48 hpf embryos and enlarged panel of the fin buds expressing wild-type kcnk5bS345-GFP and rcan2-mCherry (J), or expressing calcineurin-dephosphorylated mimic kcnk5bS345A-GFP and rcan2-mCherry (K). (L) Fin bud-to-eye ratios show that rcan2-mediated enlargement of fin buds is impaired by kcnk5bS345A mutant. Experiments were repeated 3 or more time (N ≥ 3). For the fin bud size measurements, we measured 1 fin bud (E, I) or 2 fin buds (L) per embryo at 48 hpf and not at a later time points to avoid incorporating measurements of the finfold growth that start around 56 hpf. Each measured value is represented as a data point. P values represent statistical analysis by Student’s two-tailed t test. P values >0.05 are designated as “not significant” (NS). Scale bars equal 100 μm (A–D, F–H, J, K). Numerical data used in this figure are included in S4 Data. hpf, hours post fertilization.
|