
Fig. 2
- ID
- ZDB-FIG-240411-3
- Publication
- Henry et al., 2024 - Methods: A bioinformatic protocol for rapid analysis of zebrafish embryo photo-motory responses (PMR) in neurotoxicity testing
- Other Figures
- All Figure Page
- Back to All Figure Page
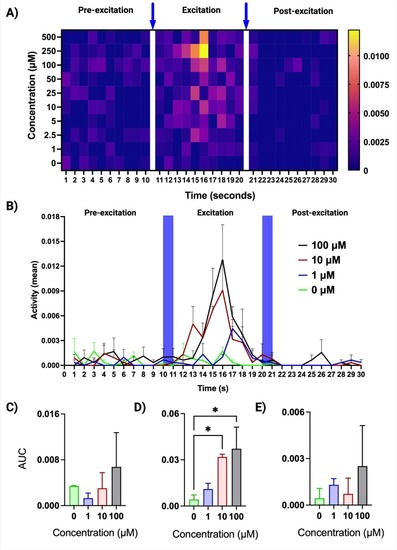
Short-term effects of clonidine exposure on zebrafish embryo PMR behavioral indices. Prior to the biotest, zebrafish embryos were exposed to clonidine at empirically selected concentrations for one hour (from 29 to 30 h post-fertilization, hpf). The PMR biotest consisted of the following sequence: 10 s of darkness (pre-excitation phase), one second high-intensity blue light pulse, 10 s of darkness (excitation phase), one second high-intensity blue light pulse, 10 s of darkness (refractory phase). Exposed embryos exhibited an increased PMR during the excitation phase, compared to non-exposed controls. A) Behavioral barcoding of PMR responses to increasing concentrations of clonidine presented as a heat map with the one-second high-intensity light stimuli pulses indicated by blue arrows. The color scheme shows aggregate activity of embryos in arbitrary units. Warmer colors indicate the increased PMR at higher concentrations during the excitation phase (middle panels). PMR barcodes can facilitate the analysis of large-scale datasets by providing a concise quantitative summary of the behaviors observed for each concentration tested across all three phases of the PMR biotest. Two independent experiments were performed with n = 20 per experiment. B) An analysis of PMR data using area under the curve (AUC) method that provides a measure of total activity during each phase upon exposure to clonidine at selected concentrations of 0, 1, 10 and 100 μM. C–E) A statistical analysis of the AUC data shown in B) depicting a significant increase in the PMR during the excitation phase (D), but not during the pre-excitation (C) and refractory phases (E). Two independent experiments were performed with n = 20 per experiment. Error bars indicate standard error of the mean (s.e.m.) Statistical significance between AUC values was determined by one-way ANOVA with Dunnett's multiple comparisons test against the control group (0 μM). *p < 0.05. |