
- Title
-
Methods: A bioinformatic protocol for rapid analysis of zebrafish embryo photo-motory responses (PMR) in neurotoxicity testing
- Authors
- Henry, J., Bai, Y., Kreuder, F., Mawdsley, D., Kaslin, J., Wlodkowic, D.
- Source
- Full text @ Comp. Biochem. Physiol. C Toxicol. Pharmacol.
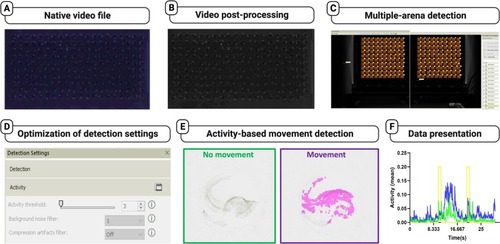
High-throughput bioinformatic protocol developed specifically for high-throughput PMR bioassays, enabling efficient analysis and screening of chemicals for their effects on zebrafish neurobehavior. The figure illustrates the step-by-step workflow involved in the bioinformatic analysis of PMR bioassays to enable high-throughput screening of neurotoxic and neuro-modulating chemicals. A) Ingestion of native video files: The process begins with the ingestion of the native video files into video editing software. These files contain recorded PMR responses of zebrafish embryos. B) Post-processing of video files: The native video files undergo post-processing steps, including conversion from color to grayscale to enhance visibility of PMR responses. Digital de-noising and sharpening techniques are applied to improve the quality and clarity of the video files. C) Ingestion into custom Ethovision XT templates: The processed video files are then ingested into custom Ethovision XT templates. Each template consists of 100 arenas, allowing for the analysis of 200 individual embryos on a single embryo array. Each video file needs to be tracked twice to complete the analysis of all embryos. D) Optimization of activity threshold: An activity threshold is optimized to ensure consistent and accurate tracking detection across the entire embryo array. This step helps in distinguishing and capturing relevant pixel intensity changes associated with PMR responses. E) Activity-based animal detection: The bioinformatic analysis involves activity-based animal detection, which tracks the pixel intensity changes in subsequent frames of the video files. This detection method allows for the identification and tracking of zebrafish embryos exhibiting PMR responses. F) Data analysis and graphical presentation: The final step includes data analysis and graphical presentation of the PMR responses. Various parameters and metrics are calculated, and the results are presented graphically to provide insights into the effects of neurotoxic and neuro-modulating chemicals on the zebrafish embryos' behavior. |
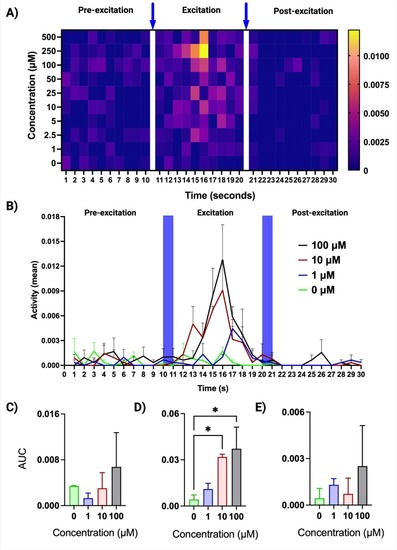
Short-term effects of clonidine exposure on zebrafish embryo PMR behavioral indices. Prior to the biotest, zebrafish embryos were exposed to clonidine at empirically selected concentrations for one hour (from 29 to 30 h post-fertilization, hpf). The PMR biotest consisted of the following sequence: 10 s of darkness (pre-excitation phase), one second high-intensity blue light pulse, 10 s of darkness (excitation phase), one second high-intensity blue light pulse, 10 s of darkness (refractory phase). Exposed embryos exhibited an increased PMR during the excitation phase, compared to non-exposed controls. A) Behavioral barcoding of PMR responses to increasing concentrations of clonidine presented as a heat map with the one-second high-intensity light stimuli pulses indicated by blue arrows. The color scheme shows aggregate activity of embryos in arbitrary units. Warmer colors indicate the increased PMR at higher concentrations during the excitation phase (middle panels). PMR barcodes can facilitate the analysis of large-scale datasets by providing a concise quantitative summary of the behaviors observed for each concentration tested across all three phases of the PMR biotest. Two independent experiments were performed with n = 20 per experiment. B) An analysis of PMR data using area under the curve (AUC) method that provides a measure of total activity during each phase upon exposure to clonidine at selected concentrations of 0, 1, 10 and 100 μM. C–E) A statistical analysis of the AUC data shown in B) depicting a significant increase in the PMR during the excitation phase (D), but not during the pre-excitation (C) and refractory phases (E). Two independent experiments were performed with n = 20 per experiment. Error bars indicate standard error of the mean (s.e.m.) Statistical significance between AUC values was determined by one-way ANOVA with Dunnett's multiple comparisons test against the control group (0 μM). *p < 0.05. |
|