
Fig. 4
- ID
- ZDB-FIG-240409-25
- Publication
- Nguyen et al., 2024 - Interplay of Zeb2a, Id2a, and Batf3 regulates microglia and dendritic cell development in the zebrafish brain
- Other Figures
- All Figure Page
- Back to All Figure Page
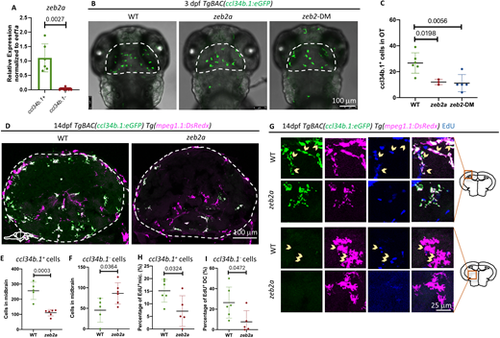
zeb2a promotes the proliferation of microglia. (A) RT-PCR showing the expression levels of zeb2a in the ccl34b.1+ (GFP+DsRedx+) and ccl34b.1− (GFP−DsRedx+) cells sorted from the brains of 4-month-old TgBAC(ccl34b.1:eGFP);Tg(mpeg1.1:DsRedx) fish. n=7 for each group. (B,C) Representative images (B) and quantification (C) of ccl34b.1+ cells in the optic tectum of 3 dpf TgBAC(ccl34b.1:eGFP) WT embryos, zeb2a single mutants and zeb2a/b double mutants (zeb2-DM). The optic tectum is indicated by dashed lines. n≥3 for each genotype. (D-F) Representative images (D) and quantification of ccl34b.1+mpeg1.1+ (GFP+DsRedx+) (E) and ccl34b.1−mpeg1.1+ (GFP−DsRedx+) (F) cells in the transverse midbrain sections of 14 dpf TgBAC(ccl34b.1:eGFP);Tg(mpeg1.1:DsRedx) WT or zeb2a mutant fish. The brain region is indicated by the dashed line. n=5 and 6 for WT and zeb2a mutants, respectively. (G-I) Representative images (G) and quantification of EdU+ ccl34b.1+mpeg1.1+ (GFP+DsRedx+) (H) and EdU+ ccl34b.1−mpeg1.1+ (GFP−DsRedx+) (I) cells in the transverse midbrain sections of 13 dpf TgBAC(ccl34b.1:eGFP);Tg(mpeg1.1:DsRedx) WT or zeb2a mutant fish. n=6 and 5 for WT and zeb2a mutants, respectively. Data are mean±s.d. Unpaired Student's t-test with Welch's correction. |