
Fig. 3
- ID
- ZDB-FIG-240409-24
- Publication
- Nguyen et al., 2024 - Interplay of Zeb2a, Id2a, and Batf3 regulates microglia and dendritic cell development in the zebrafish brain
- Other Figures
- All Figure Page
- Back to All Figure Page
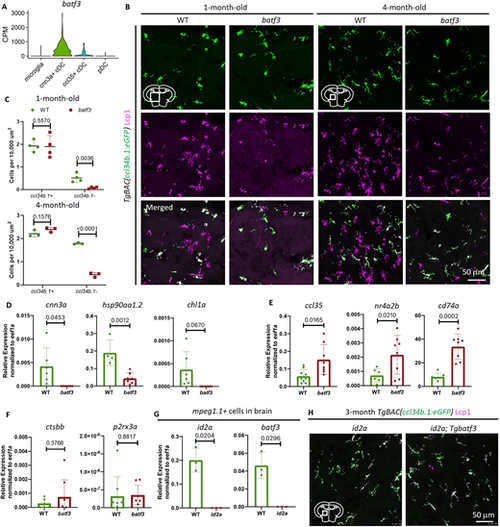
batf3 is downstream of id2a and required for cnn3a+ DC subset development. (A) Normalized expression of batf3 in cnn3a+ cDCs, ccl35+ cDCs and pDCs from the scRNA-seq dataset. (B,C) Representative images (B) and quantification (C) of the density of the ccl34b.1+ (GFP+Lcp1+) and ccl34b.1− (GFP−Lcp1+) cells in the transverse midbrain sections of 1-month-old and 4-month-old TgBAC(ccl34b.1:eGFP) WT or batf3 mutant fish. The total myeloid cells in the brain were visualized using anti-Lcp1 staining, which labels both microglia and brain-associated DCs in a WT background. n≥3 for each genotype. (D-F) RT-PCR shows the expression levels of cnn3a+ DC-specific markers (cnn3a, hsp90aa1.2 and chl1a) (D), ccl35+ DC-specific markers (ccl35, nr4a2b and cd74a) (E) and pDC-specific markers (ctsbb and p2rx3a) (F) in ccl34b.1−mpeg1.1+ cells sorted from the brains of 4-month-old TgBAC(ccl34b.1:eGFP);Tg(mpeg1.1:DsRedx) WT or batf3 mutant fish. n≥6 for each group. (G) RT-PCR shows the expression levels of id2a (left) and batf3 (right) in the mpeg1.1+ cells sorted from the brains of 5-month-old Tg(mpeg1.1:DsRedx) WT or id2a mutant fish. n=3 for each genotype. (H) Midbrain transverse sections of 4-month-old TgBAC(ccl34b.1:eGFP);id2a or Tg(mpeg1.1:batf3);id2a (id2a; Tgbatf3) transgenic mutants. The location of imaging is indicated by the box in the midbrain diagram. The microglia are marked by GFP+ and brain-associated DCs are Red+ single positive cells visualized by anti-Lcp1 staining, which labels both microglia and brain-associated DCs in a WT background. Data are mean±s.d. Unpaired Student's t-test with Welch's correction. |