
FIGURE
Fig. 7
- ID
- ZDB-FIG-240329-14
- Publication
- Godino-Gimeno et al., 2024 - Role of melanocortin system in the locomotor activity rhythms and melatonin secretion as revealed by agouti-signalling protein (asip1) overexpression in zebrafish
- Other Figures
- All Figure Page
- Back to All Figure Page
Fig. 7
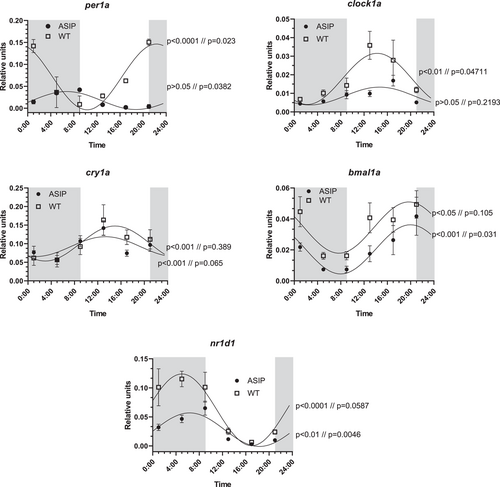
Daily rhythms of clock gene expression of asip1 Tg and wild-type animals (n = 10) kept under constant LD photoperiod (12 L/12D, lights on/off at 9 and 21 h, respectively) for 30 days. Grey bars indicate the dark phase of the photoperiod. Each point represents the mean ± SEM (n = 10). Difference among sampling times of the same genotype were assessed by one-way analysis of variance (ANOVA) and average values fitted to Cosinor curves. Significance values for each analysis are given close to the Cosinor curves (ANOVA//Cosinor). |
Expression Data
Expression Detail
Antibody Labeling
Phenotype Data
Phenotype Detail
Acknowledgments
This image is the copyrighted work of the attributed author or publisher, and
ZFIN has permission only to display this image to its users.
Additional permissions should be obtained from the applicable author or publisher of the image.
Full text @ J. Pineal Res.