
FIGURE
Fig. 6
- ID
- ZDB-FIG-240329-13
- Publication
- Godino-Gimeno et al., 2024 - Role of melanocortin system in the locomotor activity rhythms and melatonin secretion as revealed by agouti-signalling protein (asip1) overexpression in zebrafish
- Other Figures
- All Figure Page
- Back to All Figure Page
Fig. 6
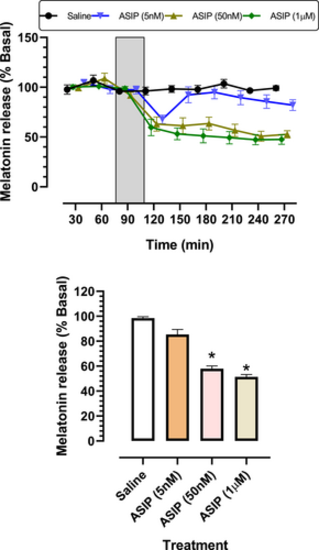
Top chart shows melatonin levels secreted from pineal glands superperfused with a constant flow rate of 5 µL/min with saline or melatonin. Fractions were collected at 30 min intervals. Each point represents the mean ± SEM (saline and 1 mM n = 5, 5 and 50 nM n = 6). Grey bar indicates superfusion period. Experiments were performed in triplicate. Bottom chart displays average levels of melatonin release from pineal glands after superfusion. Each bar represents the mean ± SEM (n = 10) from all collected fractions (saline and 1 mM n = 45, 5 and 50 nM n = 54). |
Expression Data
Expression Detail
Antibody Labeling
Phenotype Data
Phenotype Detail
Acknowledgments
This image is the copyrighted work of the attributed author or publisher, and
ZFIN has permission only to display this image to its users.
Additional permissions should be obtained from the applicable author or publisher of the image.
Full text @ J. Pineal Res.