
FIGURE
Fig. 1
Fig. 1
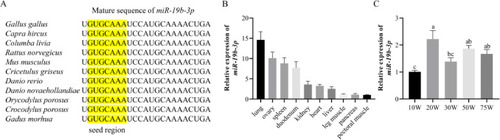
Conservative analysis and spatiotemporal expression profile of miR-19b-3p. (A) Alignment of miR-19b-3p mature sequence among species. (B) The relative expression of miR-19b-3p in different tissues. (C) The relative expression of miR-19b-3p in liver of chickens at different stages. U6 was used as an internal reference gene to estimate the relative expression of miRNA (n = 6). Different lowercase letters in each bar denote a significant difference (P < 0.05). |
Expression Data
Expression Detail
Antibody Labeling
Phenotype Data
Phenotype Detail
Acknowledgments
This image is the copyrighted work of the attributed author or publisher, and
ZFIN has permission only to display this image to its users.
Additional permissions should be obtained from the applicable author or publisher of the image.
Full text @ Poult. Sci.