
FIGURE
FIGURE 8
FIGURE 8
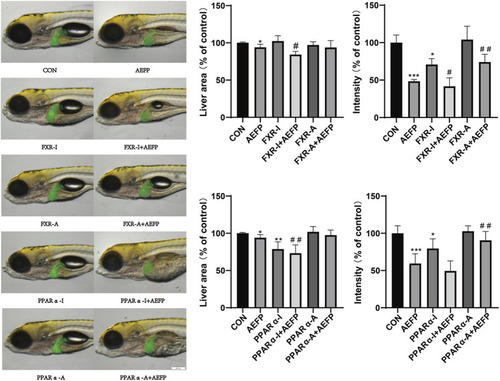
Effects of AEFP combined with FXR and PPARα agonists and inhibitors on the liver fluorescence intensity and area of zebrafish. The concentration of AEFP is 50 μg/mL, FXR-I is 1.5 μM, FXR-A is 5.5 μM, PPARα-I is 0.5 μM, and PPARα-A is 6 μM. * |
Expression Data
Expression Detail
Antibody Labeling
Phenotype Data
Phenotype Detail
Acknowledgments
This image is the copyrighted work of the attributed author or publisher, and
ZFIN has permission only to display this image to its users.
Additional permissions should be obtained from the applicable author or publisher of the image.
Full text @ Front Pharmacol