FIGURE SUMMARY
Title

Evaluation of the hepatotoxicity of Psoralea corylifolia L. based on a zebrafish model

Authors
Gao, S.Y., Zhao, J.C., Xia, Q., Sun, C., Aili, M., Talifu, A., Huo, S.X., Zhang, Y., Li, Z.J.
Source
Full text @ Front Pharmacol

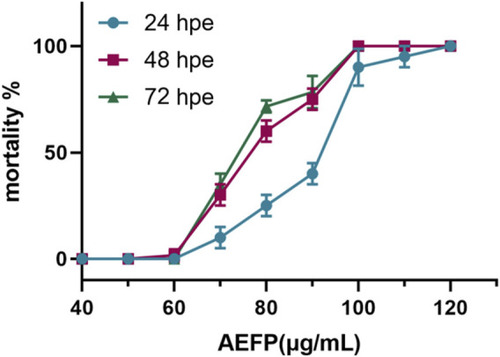
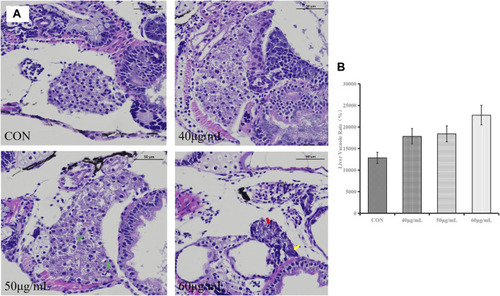
Mortality rate of zebrafish at different concentrations (%).
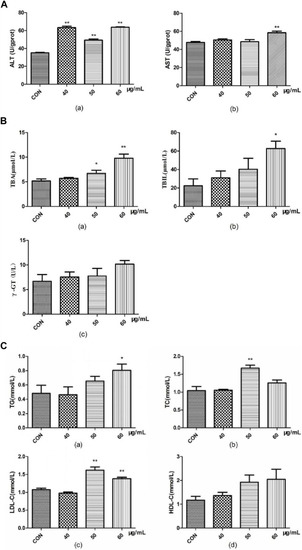
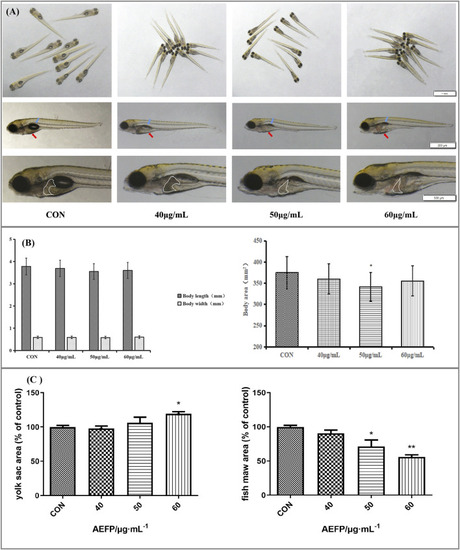
(A) Effects of AEFP on swim bladder size, yolk sac absorption, and liver phenotypic changes of zebrafish (blue arrow: swim bladder and red arrow: yolk sac). (B) Effects of AEFP on the body length and area growth of zebrafish. (C) Effects of AEFP on the yolk sac and fish maw area (x¯±s, n = 6); * p < 0. 05 vs. the CON group.

(A) Effects of AEFP on liver morphology of Zebrafish; Effects of AEFP on the (B) liver fluorescence intensity and (C) liver fluorescenc area of zebrafish (x¯±s, n = 6); *p < 0. 05, and **p < 0.01 vs. the CON group.

Effects of AEFP on (A) liver transaminase, (B) bile acid metabolism, and (C) lipid metabolism of zebrafish (x¯ ±s, n = 6); **p < 0.01 vs. the CON group.

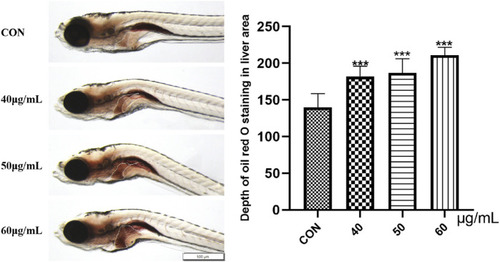
Effects of AEFP on lipid deposition in zebrafish. ***p < 0.001 vs. the CON group.

(A) Typical histopathological section photographs of zebrafish liver specimens for HE analysis (magnification ×200 and ×100); green arrow: hepatocyte vacuolation, yellow arrow: nuclear pyknosis, and red arrow: steatosis. (B) Effects of AEFP on the liver vacuole rate in zebrafish (x¯±s, n = 6), vs. the CON group.

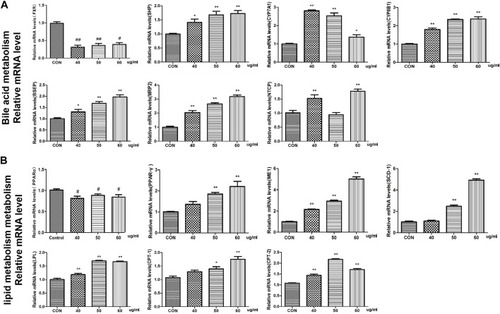
Effects of WEFP on the expression of liver injury-related genes in zebrafish (A). Gene expression of the bile acid metabolism pathway. (B) Influence of key genes in the fat metabolism pathway;*p < 0. 05 and **p < 0. 01 vs. the CON group.

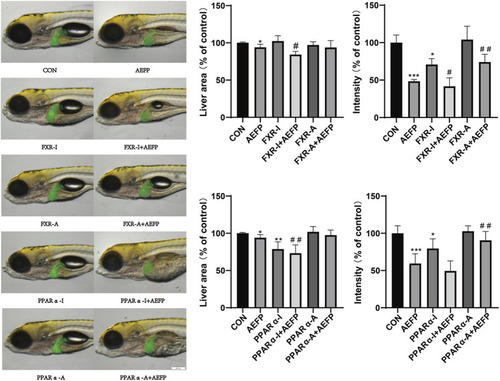
Effects of AEFP combined with FXR and PPARα agonists and inhibitors on the liver fluorescence intensity and area of zebrafish. The concentration of AEFP is 50 μg/mL, FXR-I is 1.5 μM, FXR-A is 5.5 μM, PPARα-I is 0.5 μM, and PPARα-A is 6 μM. *p < 0. 05 and ***p < 0.001 vs. the CON group; #p < 0. 05 and ##p < 0.01 vs. the AEFP group.

Effect of combined administration on the results of in situ hybridization. The concentration of AEFP is 50 μg/mL, FXR-I is 1.5 μM, FXR-A is 5.5 μM, PPARα-I is 0.5 μM, and PPARα-A is 6 μM. ***p < 0.001 vs. the CON group; #p < 0. 05 and ##p < 0.01 vs. the AEFP group.

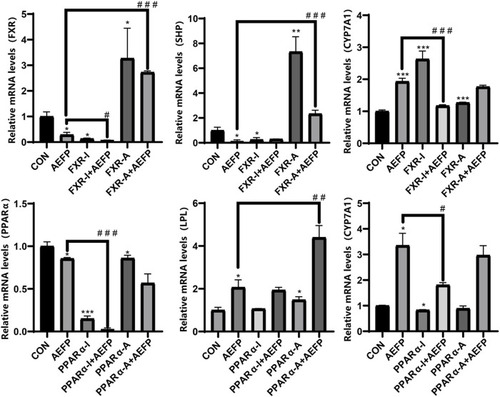
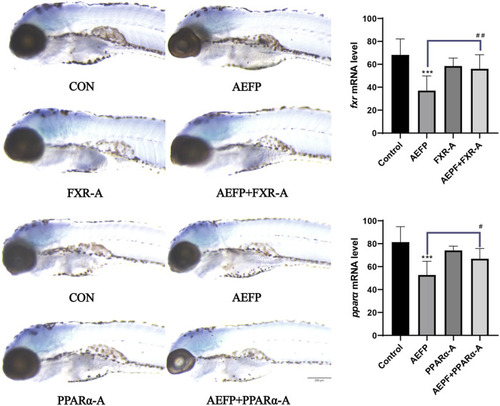
Effect of combined administration on the results of mRNA. The concentration of AEFP is 50 μg/mL, FXR-I is 1.5 μM, FXR-A is 5.5 μM, PPARα-I is 0.5 μM, and PPARα-A is 6 μM. *p < 0.05, **p < 0.01, and ***p < 0.001 vs. the CON group; #p < 0. 05, ##p < 0.01, and ###3 p < 0.001 vs. the AEFP group.

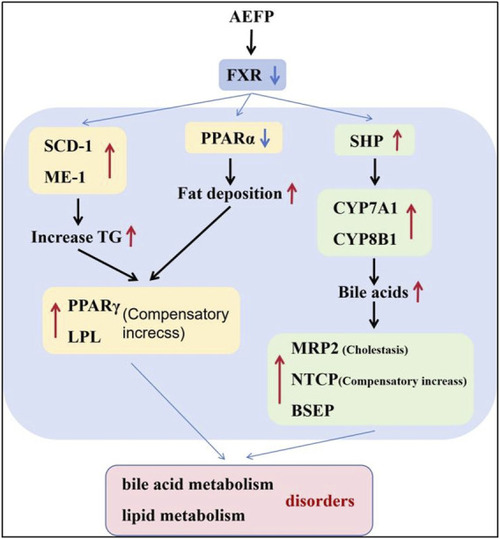
Effects of AEFP on the pathways in zebrafish.

Acknowledgments
This image is the copyrighted work of the attributed author or publisher, and ZFIN has permission only to display this image to its users. Additional permissions should be obtained from the applicable author or publisher of the image. Full text @ Front Pharmacol