FIGURE

Figure 8

ID
ZDB-FIG-240226-98
Publication
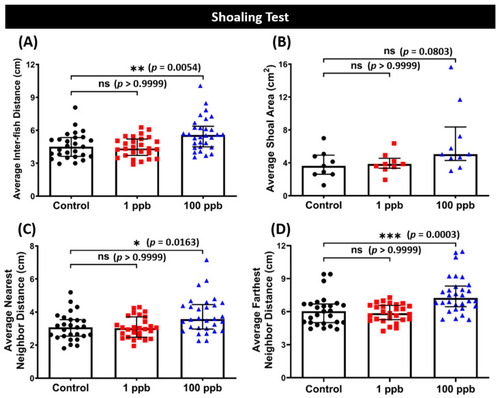
Feng et al., 2024 - Evaluation of Tacrolimus' Adverse Effects on Zebrafish in Larval and Adult Stages by Using Multiple Physiological and Behavioral Endpoints
Other Figures
All Figure Page
Back to All Figure Page
Figure 8

(A) Average inter-fish distance, (B) average shoal area, (C) average nearest neighbor distance, and (D) average farthest neighbor distance of zebrafish after being exposed to tacrolimus at two different concentrations: 1 ppb (red) and 100 ppb (blue) compared to control (black). The data are expressed as the median with an interquartile range. The statistical analyses were conducted using the Kruskal–Wallis test, followed by Dunn’s multiple comparisons test. The statistical comparisons were performed between the control and each treated group (shoal size = 3 fishes; n control & 1 ppb = 27, n 100 ppb = 30; ns = not significant, * p < 0.05, ** p < 0.01, *** p < 0.001).

Expression Data

Expression Detail
Antibody Labeling
Phenotype Data

Phenotype Detail
Acknowledgments
This image is the copyrighted work of the attributed author or publisher, and ZFIN has permission only to display this image to its users. Additional permissions should be obtained from the applicable author or publisher of the image. Full text @ Biology (Basel)