
Fig. 8
- ID
- ZDB-FIG-240226-19
- Publication
- Baek et al., 2022 - Single-cell transcriptome analysis reveals three sequential phases of gene expression during zebrafish sensory hair cell regeneration
- Other Figures
- All Figure Page
- Back to All Figure Page
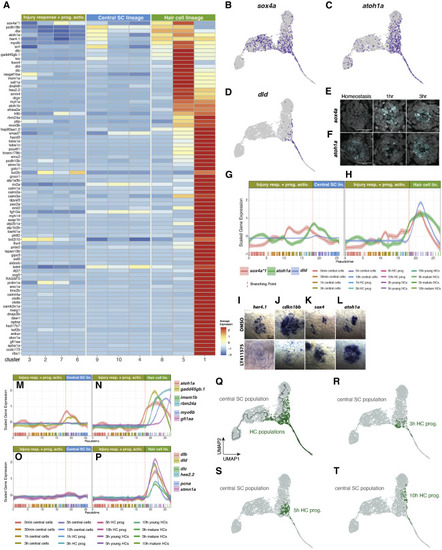
Pseudotime analysis (HC lineage after the branch point) (A) Heatmap of the average expression of genes selectively enriched in HC lineage cells, partitioned by Louvain clusters. (B–D) Feature plots of sox4a (B), atoh1a (C), and dld (D). (E and F) Fluorescent ISH (HCR) images of sox4a (E) and atoh1a (F) with DAPI in homeostasis, 1 h, and 3 h after HC death. Scale bar, 20 μm. (G and H) Line plots of sox4a, atoh1a, and dld scaled expression along the pseudotime trajectory in the (G) central SC lineage and (H) HC lineage. Individual cells are represented by color-coded tics on the x axis. (I–L) ISH images of her4.1, cdkn1bb, sox4a, and atoh1a in 5dpf DMSO- or LY411575-treated (to inhibit Notch signaling) neuromasts. Larvae were treated for 6 h before fixation. Scale bar, 10 μm. (M and N) Line plots of the scaled expression of atoh1a, insm1b, myo6b, gadd45gb.1, rbm24a, and gfi1aa along the pseudotime trajectory in the (M) central SC lineage and (N) HC lineage. Individual cells are represented by color-coded tics on the x axis. (O and P) Line plots of dlb, dld, dlc, hes2.2, pcna, and stmn1a scaled expression along the pseudotime trajectory in the (O) central SC lineage and (P) HC lineage. (Q) UMAP of the distribution of HC populations comprised HC progenitors, young HCs, and mature HCs. (R–T) UMAP of the distribution of 3 h, 5 h, and 10 h HC progenitor populations, respectively. |
Reprinted from Developmental Cell, 57(6), Baek, S., Tran, N.T.T., Diaz, D.C., Tsai, Y.Y., Acedo, J.N., Lush, M.E., Piotrowski, T., Single-cell transcriptome analysis reveals three sequential phases of gene expression during zebrafish sensory hair cell regeneration, 799-819.e6, Copyright (2022) with permission from Elsevier. Full text @ Dev. Cell