
FIGURE
Fig. 7
- ID
- ZDB-FIG-240226-18
- Publication
- Baek et al., 2022 - Single-cell transcriptome analysis reveals three sequential phases of gene expression during zebrafish sensory hair cell regeneration
- Other Figures
- All Figure Page
- Back to All Figure Page
Fig. 7
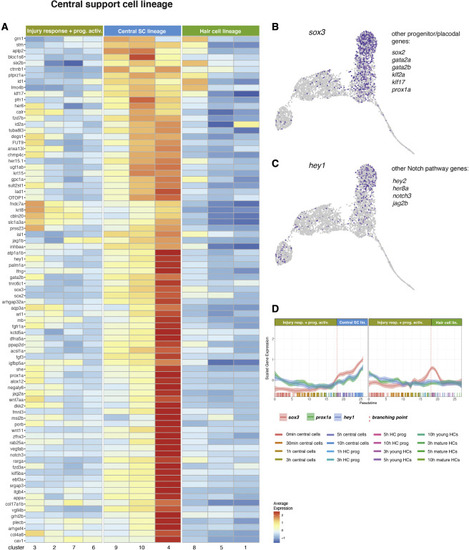
Pseudotime analysis (central SC lineage after the branch point) (A) Heatmap of the average expression of genes selectively enriched in the central SC lineage, partitioned by Louvain clusters. (B) Feature plot of sox3 and list of other expressed genes. (C) Feature plot of hey1 and list of Notch pathway members that are also expressed. (D) Line plots of the scaled expression of sox3, prox1a, and hey1 along the pseudotime trajectory in cells of the central SC lineage and HC lineage cells. Individual cells are represented by color-coded tics on the x axis. |
Expression Data
Expression Detail
Antibody Labeling
Phenotype Data
Phenotype Detail
Acknowledgments
This image is the copyrighted work of the attributed author or publisher, and
ZFIN has permission only to display this image to its users.
Additional permissions should be obtained from the applicable author or publisher of the image.
Reprinted from Developmental Cell, 57(6), Baek, S., Tran, N.T.T., Diaz, D.C., Tsai, Y.Y., Acedo, J.N., Lush, M.E., Piotrowski, T., Single-cell transcriptome analysis reveals three sequential phases of gene expression during zebrafish sensory hair cell regeneration, 799-819.e6, Copyright (2022) with permission from Elsevier. Full text @ Dev. Cell