|
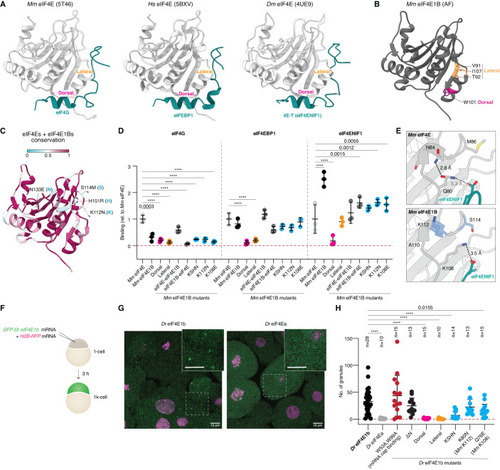
Specific eIF4E1b residues mediate eIF4ENIF1 binding and localization to P-bodies in the embryo. (A) Structures of eIF4E proteins (in gray) bound to the eIF4E-binding motifs (in teal) of eIF4G (PDB-5T46; Grüner et al, 2016), eIF4EBP1 (PDB-5BXV; Sekiyama et al, 2015), and 4E-T/eIF4ENIF1 (PDB-4UE9; Peter et al, 2015). (B) AlphaFold (AF)-predicted structure of mouse eIF4E1B. Residues located at the dorsal and lateral surfaces are highlighted in magenta and orange, respectively. (C) The AF structure of mouse eIF4E1B is colored based on amino acid conservation among vertebrate eIF4E and eIF4E1B proteins (sequences in Fig. EV1A). Residues in the N-terminal half that differ in eIF4E1Bs but are conserved in eIF4Es are indicated (first residue: eIF4E1b; second residue: eIF4E). (D) Quantification of eIF4G, eIF4EBP1 and eIF4ENIF1 binding to mouse eIF4E1B wild-type and mutant proteins in pulldowns with E. coli lysates (see Appendix Fig. S3B; n = 3 independent experiments), compared to mouse eIF4E. eIF4E and eIF4E1B data are also plotted in Fig. 2D. KSHN refers to the residues highlighted in (C). (E) AF-predicted structures of mouse eIF4E (top) or eIF4E1B (bottom) in complex with the eIF4E-binding motif of human eIF4ENIF1. Distances are indicated; interactions are depicted with dashed lines. (F) Assay to test the contribution of specific amino acids in determining the subcellular localization of eIF4E1b in zebrafish embryos. mRNAs were co-injected into 1-cell embryos; embryos were imaged after 3 h. (G) Representative confocal microscopy pictures of live embryos transiently expressing GFP-tagged eIF4E1b or eIF4Ea (green) and H2B-RFP (magenta). Regions delimited by dashed boxes are shown at a higher magnification (scale bars = 10 μm). (H) The number of eIF4E-positive granules counted in three images taken at different positions of the embryo (n = embryos). Data information: (D, H) significance was determined with two-way (D) or one-way (H) ANOVA followed by Dunnett’s test (****P value < 0.0001). Lines indicate mean with SD. Source data are available online for this figure.
|