FIGURE SUMMARY
Title

eIF4E1b is a non-canonical eIF4E protecting maternal dormant mRNAs

Authors
Lorenzo-Orts, L., Strobl, M., Steinmetz, B., Leesch, F., Pribitzer, C., Roehsner, J., Schutzbier, M., Dürnberger, G., Pauli, A.
Source
Full text @ EMBO Rep.

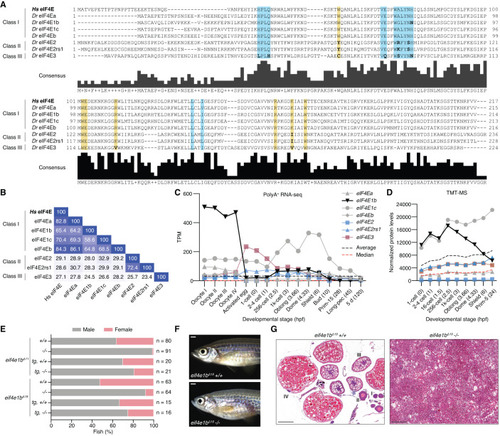
eIF4E1b is a class I eIF4E protein with an essential role in zebrafish oogenesis.

(A) Alignment of human (Homo sapiens, Hs) and zebrafish (Danio rerio, Dr) eIF4E proteins. Highlighted regions indicate the amino acids involved in the interaction with the mRNA cap (yellow) and eIF4E-binding motifs (blue); residues in the highlighted regions with a different polarity than human eIF4E are indicated in bold. (B) Percentage identity matrix of the proteins shown in (A). (C) The abundance of eIF4E transcripts during zebrafish oogenesis and embryogenesis based on published polyA-selected RNA-seq data (Pauli et al, 2012; Cabrera-Quio et al, 2021). TPM transcripts per million. X axis indicates developmental stages (hours post fertilization, hpf, in brackets). (D) eIF4E protein levels (represented with the same colors and symbols as in (C) during early zebrafish embryogenesis obtained by tandem mass tag mass spectrometry (TMT-MS), normalized to spike-in proteins. X axis indicates developmental stages (hpf in brackets). (E) Percentage of males and females of homozygous (−/−) and wild-type (+/+) siblings obtained from heterozygous eif4e1b incrosses (n = number of fish), as determined by secondary sexual characteristics. Expression of 3xflag-sfGFP-eIF4E1b (tg) partially rescues the male bias observed in the two homozygous fish mutants. (F) Representative images of wild-type (top) and homozygous eif4e1b (bottom) female siblings (scale bar = 1 mm). (G) Hematoxylin and eosin staining of sectioned ovaries isolated from wild-type and homozygous eif4e1b fish. Mutant ovaries have no oocytes. Stages of oocyte development are indicated with roman numbers in the wild-type ovary sections. Scale bars = 200 μm. Source data are available online for this figure.

eIF4E1b interacts with the mRNA cap, eIF4EBP1, and eIF4ENIF1 and localizes to cytoplasmic foci in oocytes and embryos.

(A) eIF4E interaction with the mRNA cap (top, PDB-5BXV, Sekiyama et al, 2015) is mediated by two tryptophans that are conserved in eIF4E1B (bottom, AlphaFold (AF) prediction of mouse eIF4E1B). The superimposition of both structures is shown on the right, with eIF4E in light gray, eIF4E1B in dark gray, and m7G in red. (B) (Left) Coomassie-stained gels from immunoprecipitation assays with E. coli lysates containing zebrafish eIF4Ea and human eIF4E1B (wild-type and tryptophan mutants, see (A)) using m7G-coated beads. The eIF4E-binding motif (4EBM) of human eIF4EBP1 is used as a negative control. Quantification of eIF4E binding to m7G (relative to eIF4Ea) is shown on the right. (C) Scheme of in vitro pulldown assays. Lysates of E. coli cells expressing His- and MBP-tagged eIF4Es were incubated with Ni2+ beads. Lysates containing MBP-tagged 4EBMs of human eIF4G, eIF4EBP1, or eIF4ENIF1 (see Appendix Fig. S2C–E) were added to the beads. After elution, binding of 4EBMs to eIF4E was assessed by SDS-PAGE and Coomassie staining. (D) (Left) Coomassie-stained gels of pulldowns with mouse eIF4E, eIF4Es from zebrafish (eIF4Ea, eIF4E2, and eIF4E3), and mouse eIF4E1B with 4EBMs from eIF4G, eIF4EBP1, and eIF4ENIF1. Quantifications are shown on the right. (E, F) Confocal microscopy images of fixed transgenic zebrafish oocytes and embryos expressing 3xflag-sfGFP-eIF4E1c (E) and 3xflag-sfGFP-eIF4E1b (F). Mitochondria were stained with Mitotracker (in magenta). Images at two different magnifications are shown at the top and bottom (scale bars correspond to 100 and 10 μm, respectively). The Balbiany body (Bb) is indicated by a dashed box; individual channels are shown in boxes for the Bb. Cytoplasmic foci are highlighted with arrows. Data information: (B, D) n = 3 independent experiments. Significance was determined using two-way ANOVA (B) or one-way ANOVA (D) followed by Tukey’s (B) or Dunnett’s (D) multiple comparisons test (****P value < 0.0001). Lines indicate mean with SD. (B, D) Predicted molecular weights (in kDa) are: Dr eIF4Ea, Hs eIF4E1B, Mm eIF4E1B, Dr eIF4E1c and Dr eIF4E2 = 65; Mm eIF4E = 66; Dr eIF4E3 = 64; Hs eIF4G[4EBM] and Hs eIF4ENIF1[4EBM] = 53; Hs eIF4EBP1[4EBM] = 52. Source data are available online for this figure.

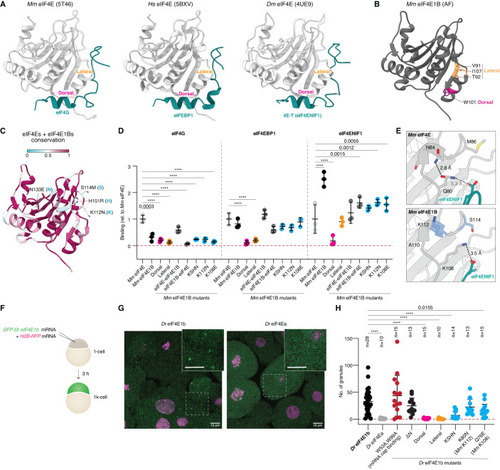
Specific eIF4E1b residues mediate eIF4ENIF1 binding and localization to P-bodies in the embryo.

(A) Structures of eIF4E proteins (in gray) bound to the eIF4E-binding motifs (in teal) of eIF4G (PDB-5T46; Grüner et al, 2016), eIF4EBP1 (PDB-5BXV; Sekiyama et al, 2015), and 4E-T/eIF4ENIF1 (PDB-4UE9; Peter et al, 2015). (B) AlphaFold (AF)-predicted structure of mouse eIF4E1B. Residues located at the dorsal and lateral surfaces are highlighted in magenta and orange, respectively. (C) The AF structure of mouse eIF4E1B is colored based on amino acid conservation among vertebrate eIF4E and eIF4E1B proteins (sequences in Fig. EV1A). Residues in the N-terminal half that differ in eIF4E1Bs but are conserved in eIF4Es are indicated (first residue: eIF4E1b; second residue: eIF4E). (D) Quantification of eIF4G, eIF4EBP1 and eIF4ENIF1 binding to mouse eIF4E1B wild-type and mutant proteins in pulldowns with E. coli lysates (see Appendix Fig. S3B; n = 3 independent experiments), compared to mouse eIF4E. eIF4E and eIF4E1B data are also plotted in Fig. 2D. KSHN refers to the residues highlighted in (C). (E) AF-predicted structures of mouse eIF4E (top) or eIF4E1B (bottom) in complex with the eIF4E-binding motif of human eIF4ENIF1. Distances are indicated; interactions are depicted with dashed lines. (F) Assay to test the contribution of specific amino acids in determining the subcellular localization of eIF4E1b in zebrafish embryos. mRNAs were co-injected into 1-cell embryos; embryos were imaged after 3 h. (G) Representative confocal microscopy pictures of live embryos transiently expressing GFP-tagged eIF4E1b or eIF4Ea (green) and H2B-RFP (magenta). Regions delimited by dashed boxes are shown at a higher magnification (scale bars = 10 μm). (H) The number of eIF4E-positive granules counted in three images taken at different positions of the embryo (n = embryos). Data information: (D, H) significance was determined with two-way (D) or one-way (H) ANOVA followed by Dunnett’s test (****P value < 0.0001). Lines indicate mean with SD. Source data are available online for this figure.

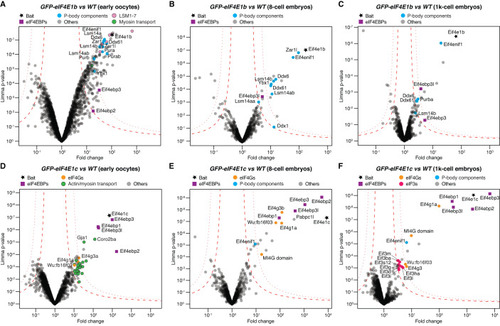
eIF4E1b interacts with P-body components in zebrafish oocytes and embryos.

Volcano plots of proteins enriched by immunoprecipitation followed by mass spectrometry (IP-MS) using GFP-tagged eIF4E1b (AC) or eIF4E1c (DF) as bait. Wild-type (WT) lysates were used to control for unspecific binding to the beads. Early oocytes correspond to oogonia and stage I–II oocytes. Permutation-based false discovery rates (FDRs) are displayed as dotted (FDR < 0.01) and dashed (FDR < 0.05) lines (n = 3 biological replicates). Statistical significance was determined using limma (Smyth, 2005).

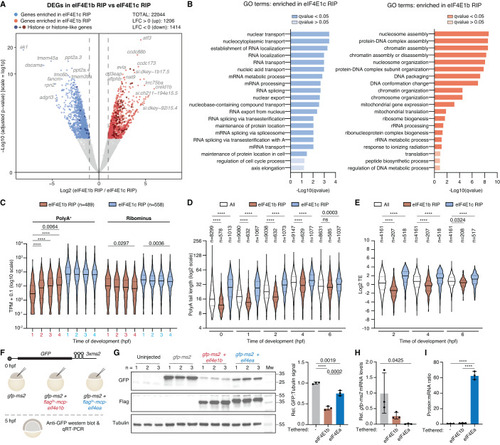
eIF4E1b binds to translationally repressed mRNAs involved in chromatin regulation.

(A) Differential expression gene (DEG) analysis of mRNAs immunoprecipitated with eIF4E1b or eIF4E1c at 1.25 h post fertilization. mRNAs significantly enriched in eIF4E1b (n = 3 biological replicates) or eIF4E1c (n = 2 biological replicates) immunoprecipitations are shown in red and blue, respectively (P value < 0.005). Genes encoding proteins with histone and histone-like domains are highlighted in a darker color. Significance was determined using Benjamini–Hochberg-corrected Wald test (DeSeq2). (B) Gene ontology (GO) analysis of mRNAs that are specifically bound to eIF4E1c (left, in blue) or to eIF4E1b (right, in red). (C) Expression levels (in transcript per million, TPM) of mRNAs enriched in eIF4E1b and eIF4E1c RIPs during zebrafish embryogenesis according to published RNA-seq datasets obtained with polyA-selection (PolyA+) and rRNA depletion (Ribominus) protocols (Cabrera-Quio et al, 2021). (D) PolyA tail length of mRNAs enriched in RIPs with eIF4E1b or eIF4E1c during zebrafish embryonic development based on published TAIL-seq data (Chang et al, 2018) (ns non-significant). (E) Translational efficiency (TE) of mRNAs enriched in eIF4E1b and eIF4E1c RIPs during zebrafish embryogenesis based on published TE data (Subtelny et al, 2014). (F) Schematic of the eIF4E tethering assay: A GFP reporter mRNA containing MS2 loops at the 3′ UTR (top) and an mRNA containing eIF4Ea or eIF4E1b fused to an N-terminal 3xflag-MCP (MS2 Coat Protein) tag were injected into 1-cell embryos. After 5 h, GFP protein and mRNA levels were assessed by western blot and RT-qPCR, respectively. (G) Western blots showing GFP (top), Flag (middle) and α-Tubulin (loading control; bottom) protein levels in 5 hpf embryos after injection with the mRNAs described in (F). Uninjected embryos are also shown. Quantification of GFP signal normalized to α-Tubulin is shown on the right (n = 3 experimental replicates). (H) Levels (assessed by RT-qPCR) of GFP reporter mRNA tethered to either eIF4Ea or eIF4E1b compared to non-tethered GFP mRNA in 5 hpf embryos (n = 3 experimental replicates). (I) Protein to mRNA ratio of the GFP reporter mRNA alone or tethered to eIF4Ea or eIF4E1b, as estimated from western blot (G) and RT-qPCR (H) (n = 3 experimental replicates). Data information: (CE) lines indicate median and first and third quartiles; in (GI), columns indicate mean and error bars show the SD. (CE) Significance was assessed with Kruskal–Wallis followed by Dunn’s test. (GI) Significance was determined using ordinary one-way ANOVA followed by a Tukey’s multiple comparisons test. (C) Significance was calculated for eIF4E1b RIP or eIF4E1c RIP in PolyA+ or Ribominus data (if not stated, P value > 0.005). (D, E) statistics are shown only for comparisons within the same developmental stage. Hpf hours post fertilization. ****P value < 0.0001. Source data are available online for this figure.

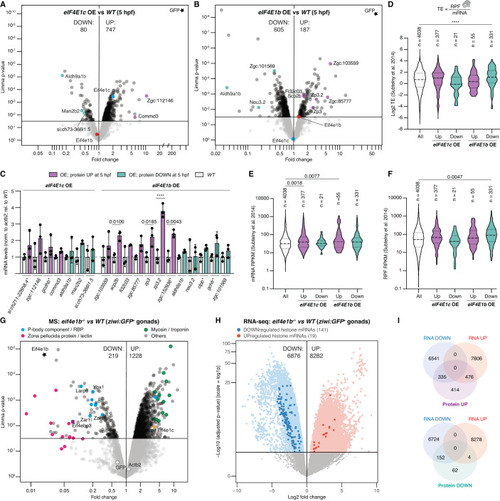
eIF4E1b levels negatively correlate with total protein levels in zebrafish embryos and gonads.

(A, B) Volcano plots of MS data obtained from lysates of 5 hpf embryos expressing either actb2:3xflag-sfGFP-eIF4E1c (eIF4E1c OE; (A)) or actb2:3xflag-sfGFP-eIF4E1b (eIF4E1b OE; (B)) compared to wild type (WT). n = 3 biological replicates. (C) mRNA levels (assessed by RT-qPCR) of proteins dysregulated in eIF4E1c OE (left) or eIF4E1b OE (right) embryos in eIF4E1b OE, eIF4E1c OE and WT embryos at 5 hpf (n = 3 biological replicates). Columns indicate mean and error bars indicate SD. (D–F) Translational efficiency (TE; (D)), mRNA levels (E) and ribosome-protected fragments (RPF; (F)) of genes encoding proteins dysregulated in eIF4E1c OE or eIF4E1b OE embryos (data from 4 hpf wild-type embryos from Subtelny et al, 2014). Lines indicate median and first and third quartiles. (G, H) Volcano plots representing mass spectrometry (MS; (G)) and RNA sequencing (RNA-seq; (H)) data from eif4e1b mutant and wild-type female gonads isolated from juvenile fish with high ziwi:GFP expression (n = 3 biological replicates). (I) Venn diagram showing the overlap between up- or downregulated proteins with up- or downregulated mRNAs in eif4e1b mutant gonads isolated from high ziwi:GFP-expressing juvenile fish. Data information: significance was calculated using an ordinary one-way ANOVA followed by Sidak’s (C), Dunett’s multiple comparisons tests (DF), limma (A, B, G, Smyth, 2005), and Benjamini–Hochberg-corrected Wald test (DeSeq2; H). ****P value < 0.001. RPKM reads per kilobase of transcript per million mapped reads, Hpf hours post fertilization. Source data are available online for this figure.

Acknowledgments
This image is the copyrighted work of the attributed author or publisher, and ZFIN has permission only to display this image to its users. Additional permissions should be obtained from the applicable author or publisher of the image. Full text @ EMBO Rep.