
Fig. 3
- ID
- ZDB-FIG-240215-125
- Publication
- Peles et al., 2022 - Glucocorticoid-sensitive period of corticotroph development-Implications for mechanisms of early life stress
- Other Figures
- All Figure Page
- Back to All Figure Page
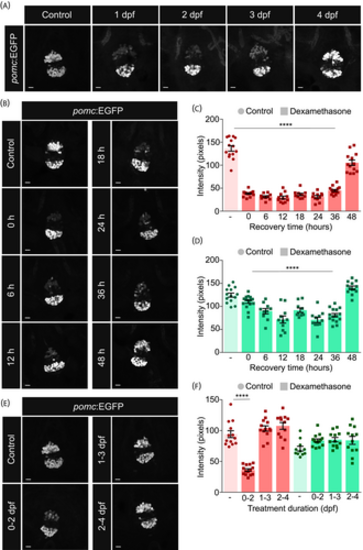
The effect of dexamethasone on proopiomelanocortin (POMC) cells is pronounced at early stages of development but reversible. (A) Larvae were treated with 35 μM dexamethasone beginning at 1, 2, 3 or 4 days post fertilization (dpf). Treated and untreated control larvae were collected at 5 dpf, fixed and the pituitary was imaged. Dexamethasone had a severe effect on the anterior cluster after at least 48 h of treatment. N = 10–15 per group. (B) Larvae were treated with 25 μM dexamethasone from 1 dpf. Dexamethasone was washed off from the larvae from 6 dpf at regular 6 hour intervals. All groups of larvae were collected at 8 dpf, fixed and the pituitary was imaged. Time indicated in hours (h) represents the duration between dexamethasone withdrawal and fixation. N = 11–14 per group. (C, D) The intensity of green fluorescent protein (GFP)-positive POMC cells in the anterior (C) and posterior (D) clusters of the pituitary following different time of withdrawal from dexamethasone was quantified from (B). The reduction in the anterior cluster required 48 h to come back to normal levels. One-way analysis of variance (ANOVA) followed by Dunnett's multiple comparisons test n = 10–16 larvae per group. (E) Larvae were treated with 35 μM dexamethasone for 48 h between 0–2, 1–3, or 2–4 dpf. Dexamethasone was washed off from the larvae at 2, 3 or 4 dpf, respectively, and larvae were let to recover. Larvae were collected at 6 dpf, fixed and the pituitary was imaged. N = 12–14 per group. (F) The intensity of GFP-positive POMC cells in the anterior (red) and posterior (green) clusters of the pituitary following different windows of treatment with dexamethasone was quantified from (E). The reduction in the anterior cluster was irreversible when dexamethasone was applied prior to 24 hpf between 0–2 dpf. One-way ANOVA followed by Dunnett's multiple comparisons test n = 10–16 larvae per group. Data presented as mean ± SEM, *p < .05, ****p < .0001, scale bars: 10 μm. |