FIGURE

Figure 6

ID
ZDB-FIG-240202-23
Publication
?tefl et al., 2024 - Caveolae disassemble upon membrane lesioning and foster cell survival
Other Figures
All Figure Page
Back to All Figure Page
Figure 6

Cavin1a knockout zebrafish embryos show decreased abundance of caveolar proteins in the sarcolemma

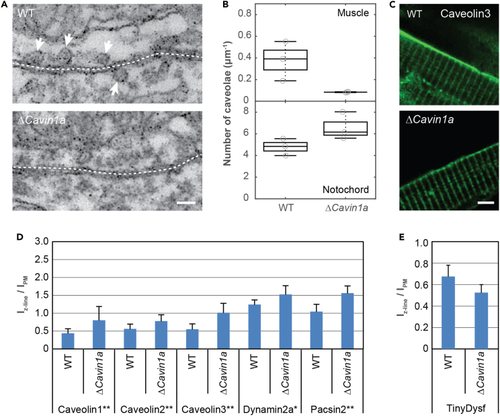
(A) EM images of slices of muscle tissue in wild-type (top) and Δcavin1a zebrafish embryos (bottom). White arrows point to caveolar structures. Scale bar, 100 nm.

(B) Number of caveolae in muscle and notochord cells of wild-type and Δcavin1a zebrafish embryos. Each data point corresponds to the value determined for one muscle cell.

(C) Representative fluorescence images of wild-type and Δcavin1a strains injected with caveolin3:Clover. Scale bar, 5 μm.

(D) Abundance of caveolar proteins tagged with Clover in the Z-lines, relative to the abundance in the sarcolemma. Error bars represent the SD. The significance was tested using the Bonferroni and Holm t test.

(E) Abundance of TinyDysf-Clover in the Z-lines, relative to the abundance in the sarcolemma.

Expression Data

Expression Detail
Antibody Labeling
Phenotype Data

Phenotype Detail
Acknowledgments
This image is the copyrighted work of the attributed author or publisher, and ZFIN has permission only to display this image to its users. Additional permissions should be obtained from the applicable author or publisher of the image. Full text @ iScience