FIGURE

Fig. 1

ID
ZDB-FIG-240202-1
Publication
Larsson et al., 2024 - Repurposing proteasome inhibitors for improved treatment of triple-negative breast cancer
Other Figures
All Figure Page
Back to All Figure Page
Fig. 1

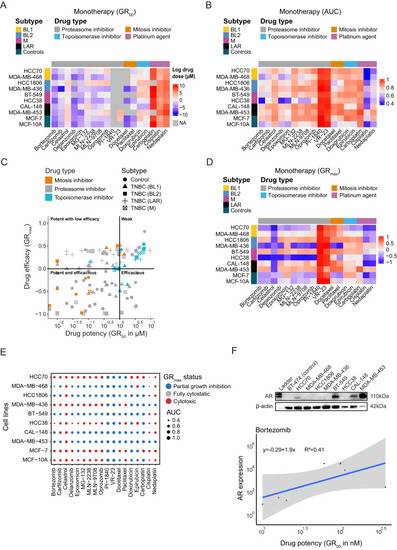
Cell line characterization and monotherapy for eight TNBC and two control cell lines.

A and B show the efficiency of the 18 drugs on eight TNBC cell lines (BT-549, CAL-148, HCC1806, HCC38, HCC70, MDA-MB-436, MDA-MB-453, and MDA-MB-468) and two controls (MCF-10A and MCF-7) using growth rate inhibition (GR50) and area under the curve (AUC). Bortezomib, carfilzomib, cisplatin, delanzomib, docetaxel, epoxomicin, MLN-2238, MLN-9708 and nedaplatin were shown to be potent drugs (GR50 < 1000 nM and AUC < 0.80). C Scatterplot illustrating cytotoxicity with GRmax and GR50 values. Topoisomerases were shown to be weak inhibitors, while proteasome inhibitors, mitosis inhibitors, and platinum agents had an adverse effect on cell viability. D and E show the cytotoxicity of all 18 drugs at the highest tested dose. The most cytotoxic drugs were celastrol, cisplatin, and nedaplatin, and the most sensitive cell lines to the highest dose were HCC38, HCC70, and MDA-MB-436. F show expression of AR in the 10 cell lines. Cell lines BT-549 (M), CAL-148 (LAR), HCC70 (BL1) and MDA-MB-453 (LAR) were AR-positive. Elevated AR expression was associated with high GR50 values.

Expression Data

Expression Detail
Antibody Labeling
Phenotype Data

Phenotype Detail
Acknowledgments
This image is the copyrighted work of the attributed author or publisher, and ZFIN has permission only to display this image to its users. Additional permissions should be obtained from the applicable author or publisher of the image. Full text @ Cell Death Discov