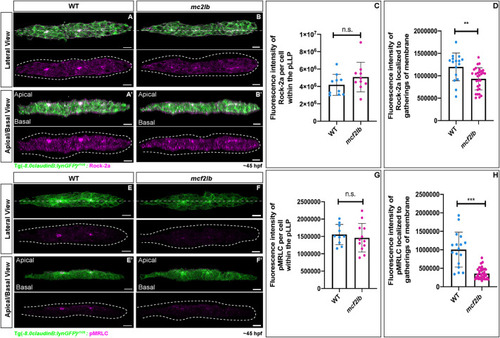
RhoA signaling is disrupted in mcf2lb mutants. (A-B′) Immunostaining for Rock2a in WT and mcf2lb mutants. A,B show the lateral view (top-down); A′,B′ show the apical-basal view (images were virtually rotated 90° around the x-axis; dashed lines A,B). All images are z-projections. Images are masked to show signal within the pLLP. Note the localization of Rock2a is diminished in mcf2lb mutant pLLP. (C) Total fluorescence of Rock2a per cell in WT (n=10 pLLPs) and mcf2lb mutants (n=10 pLLPs). (D) Fluorescence of Rock2a at rosette centers in WT (n=16 points from ten pLLP) and mcf2lb mutants (n=30 points from ten pLLPs). (E-F′) Immunostaining for pMRLC in WT and mcf2lb mutants. E,F show the lateral (top-down) view; E′,F′ show the apical-basal view (images were virtually rotated 90° around the x-axis; dashed lines E,F). All images are z-projections. Images are masked to show signal within the pLLP. Note diminished localization of pMRLC in the mcf2lb mutant pLLPs. (G) Total fluorescence of pMRLC per cell in WT (n=10 pLLPs) and mcf2lb mutants (n=13 pLLPs). (H) Fluorescence of pMRLC at the gatherings of the membranes in WT (n=17 points from ten pLLPs) and mcf2lb mutants (n=37 points from 13 pLLPs). Dotted lines indicate pLLP. **P<0.01, ***P<0.001 (unpaired two-tailed t-test). n.s., not significant. Error bars are s.d. Scale bars: 10 μm.
|
