
Fig. 4
- ID
- ZDB-FIG-240126-36
- Publication
- Shihana et al., 2023 - Investigating the role of lipid genes in liver disease using fatty liver models of alcohol and high fat in zebrafish (Danio rerio)
- Other Figures
- All Figure Page
- Back to All Figure Page
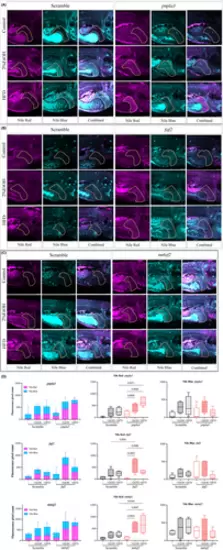
Live imaging of Nile Red and Nile Blue staining in pnpla3, faf2 and tm6sf2 crispants treated with ethanol/HFD exposure developed lipid droplets and free fatty acids. Live images show crispants (A) pnpla3 (B) faf2 and (C) tm6sf2 treated with 2% EtOH or HFD and stained with Nile Red (magenta) and Nile Blue (cyan) using confocal microscopy. A z-stack of 75 μm was compiled for each sample. Highlighted region (orange line) is the liver of each zebrafish larvae. Images were used to quantify lipid (magenta fluorescence intensity), and free fatty acid (cyan fluorescence intensity) content using Fiji ImageJ software. Bar chart (D) shows the amount of lipid and free fatty acids florescence count in each crispants. A set of 4–6 larvaewere used for the image analysis. |