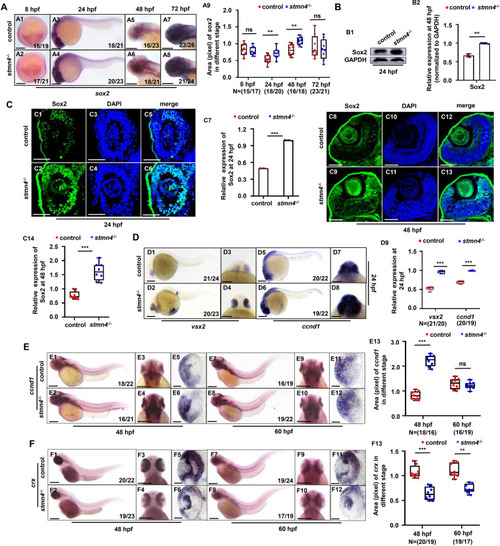
Stmn4 deficiency induced impaired differentiation of RPCs in retina. (A) Expression of sox2 at 8 hpf, 24 hpf, 48 hpf, and 72 hpf in WT and stmn4−/− embryos and larvae (A1 − A8), and the calculation of the relative expression levels of sox2 (A9). (B) Western blot analysis of Sox2 at 24 hpf in WT and stmn4−/− embryos (B1), and the calculation of the relative expression levels of Sox2 (B2). (C) Immunofluorescence assays for the expression of Sox2 at 24 hpf and 48 hpf in WT and stmn4−/− embryos (C1 − C6, C8 − C13), and the calculation of the relative expression levels (C7, C14). (D) Expression of vsx2 and ccnd1 at 24 hpf in zebrafish embryos (D1 − D8), and the calculation of the relative expression levels (D9). (E) Expression of ccnd1 at 48 hpf and 60 hpf in zebrafish embryos (E1 − E4, E7 − E10), cross-section of the eye (E5, E6, E11 − E12), and the calculation of the relative expression levels (E13). (E) Expression of crx at 48 hpf and 60 hpf in zebrafish embryos (F1 − F4, F7 − F10), cross-section of the eye (F5, F6, F11 − F12), and the calculation of the relative expression levels (F13). A1 − A8, D1, D2, D5, D6, E1, E2, E7, E8, F1, F2, F7, F8, lateral view, anterior to the left, and dorsal to the up; D3, D4, D7, D8, E3, E4, E9, E10, F3, F4, F9, F10, head to the up, and dorsal to the down. Scale bar, 200μm (A1 − A8, D1 − D8, E1 − E4, E7 − E10, F1 − F4 and E7 − E10), 100 μm (E5, E6, E11 − E12, F5, F6 and F11 − F12), 50 μm (C1 − C6 and C8 − C13). ***P < 0.001, **P < 0.01, ns, not significant
|
