
FIGURE
Figure 4
- ID
- ZDB-FIG-240114-4
- Publication
- Kwiatkowska et al., 2023 - Assessment of an Anticancer Effect of the Simultaneous Administration of MM-129 and Indoximod in the Colorectal Cancer Model
- Other Figures
- All Figure Page
- Back to All Figure Page
Figure 4
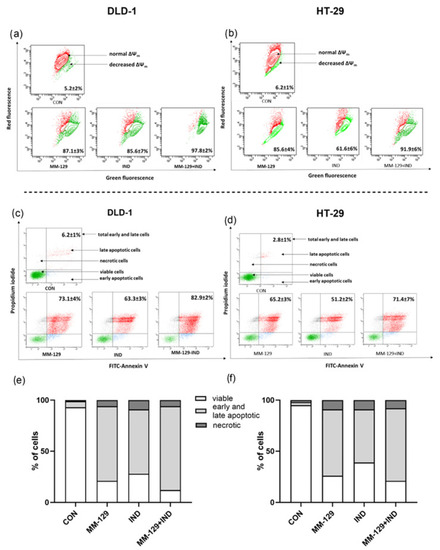
Representative dot-plots illustrating the loss of mitochondrial membrane potential, ΔΨm. ( |
Expression Data
Expression Detail
Antibody Labeling
Phenotype Data
Phenotype Detail
Acknowledgments
This image is the copyrighted work of the attributed author or publisher, and
ZFIN has permission only to display this image to its users.
Additional permissions should be obtained from the applicable author or publisher of the image.
Full text @ Cancers