
Fig. 5
- ID
- ZDB-FIG-240112-39
- Publication
- Mahony et al., 2023 - Lineage skewing and genome instability underlie marrow failure in a zebrafish model of GATA2 deficiency
- Other Figures
- All Figure Page
- Back to All Figure Page
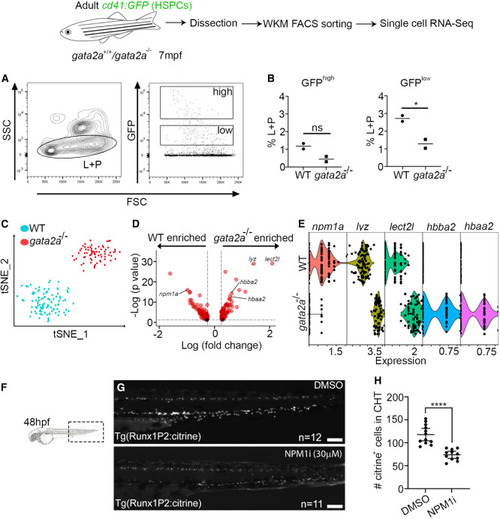
Severe npm1a downregulation in gata2a−/− HSPCs at 7 mpf (A) FACS gating strategy to analyze/isolate cd41:GFPlow HSPCs from 7 mpf adults. L, lymphoid cells; P, progenitor cells. (B) Two cd41:GFP and two cd41:GFP;gata2a−/− adults at 7 mpf and sorted live CD41:GFPlow cell analysis of GFPhigh and GFPlow fractions. GFPhigh: p = 0.0783, GFPlow: p = 0.0409, determined using a two-tailed unpaired t test. (C) scRNA-seq and tSNE clustering of WT and gata2a−/− HSPCs. We chose cells with at least 1,000 UMI counts (106 WT and 72 gata2a−/− cells) and then exported extracted barcoded reads to be retained for further analysis in cell ranger/Loupe/R. (D) Volcano plots of log2 FC vs. –log10(p value). Full list of differentially expressed genes in Table S4. (E) Violin plot (each dot represents a single cell) of npm1a, lyz, lect2l, hbba2, and hbaa2 expression in WT and gata2a−/− HSPCs. gata2a−/− vs. WT: npm1a; p = 1.06E−16. (F) Imaging schematic. lyz: p = 1.15E−29; lect2l: p = 8.76E−30; hbba2: p = 5.3E−15; hbaa2: p = 1.73E−13. (G) Imaging of the caudal haematopoietic tissue (CHT) region of Tg(Runx1p2:Citrine)+ embryos at 48 hpf. Scale bar, 100 μm. (H) Quantification. Error bars are mean with 95% confidence interval (CI). DMSO: n = 12 (biological replicates), NPM1i: n = 11 (biological replicates). ∗∗∗∗p < 0.0001, determined using a Mann-Whitney test. See also Tables S4, S7, and S8. |