
Fig. 7
- ID
- ZDB-FIG-240111-21
- Publication
- Luo et al., 2023 - Nuclear translocation of cGAS orchestrates VEGF-A-mediated angiogenesis
- Other Figures
- All Figure Page
- Back to All Figure Page
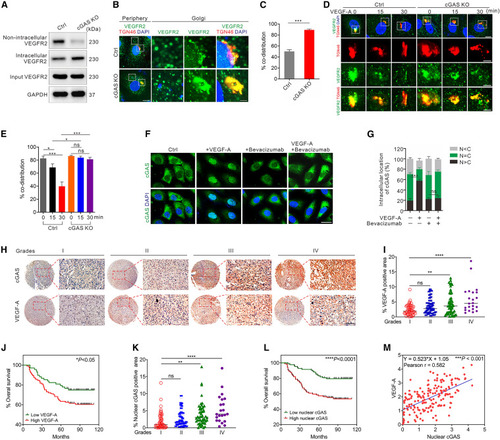
cGAS is critical for proper VEGFR2 trafficking and associated with human pathology (A) Western blot for determining the distribution of VEGFR2 expression in cGAS KO or control HUVECs. (B and C) Immunofluorescence (B) and quantification (C) of the distribution of TGN-associated VEGFR2 in cGAS KO and vector control HUVECs (n = 15/group). Scale bars, 10 μm (lower magnifications) and 2 μm (higher magnifications). (D and E) Representative images (D) and quantification (E) of the dynamic TGN-associated VEGFR2 distribution in cGAS KO and vector control HUVECs (n = 15/group) with VEGF-A stimulation at different time points. Scale bars, 10 μm (lower magnifications) and 5 μm (higher magnifications). (F and G) Representative images (F) and quantification (G) of cGAS intracellular localization in HUVECs treated with VEGF and/or bevacizumab (n = 12 random FOV/group). Scale bar, 20 μm. (H) Immunohistochemistry for determining the expression of cGAS and VEGF-A in human glioma specimens. Scale bar, 50 μm. (I and J) VEGF-A expression is positively correlated with the malignancy (I) and prognosis (J) of human gliomas. (K) The distribution of nuclear cGAS in human gliomas. (L) Patient survival analysis of high- and low-expression of nuclear cGAS in glioma specimens. (M) Correlation analyses of nuclear cGAS and VEGF-A expression in glioma specimens. Data are represented as means ± SEM. Student’s t test in (C), ANOVA in (E), (G), (I), (K); Kaplan-Meier curves in (J) and (L); Pearson’s r test in (M). ∗p < 0.05; ∗∗p < 0.01; ∗∗∗p < 0.001; ∗∗∗∗p < 0.0001; ns, not significant. |