
Fig. 3
- ID
- ZDB-FIG-240111-17
- Publication
- Luo et al., 2023 - Nuclear translocation of cGAS orchestrates VEGF-A-mediated angiogenesis
- Other Figures
- All Figure Page
- Back to All Figure Page
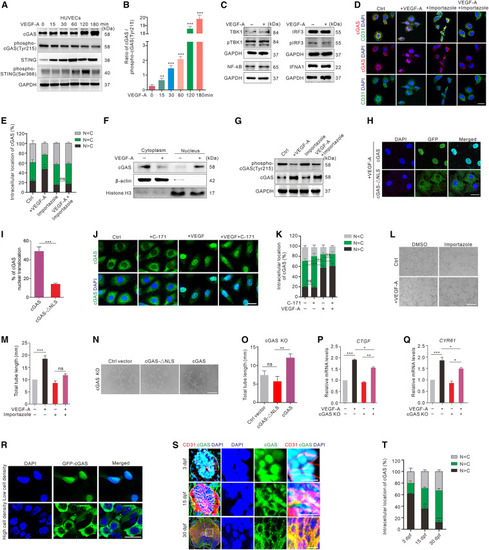
cGAS nuclear translocation is involved in VEGF-A-mediated angiogenesis (A and B) Western blot (A) and quantification (B) of the dephosphorylation of cGAS and STING in HUVECs after VEGF-A stimulation at different time points. (C) The expression of IFNA1, NF-κB, IRF3, pIRF3, TBK1, and pTBK1 in HUVECs with or without VEGF-A stimulation (n = 3 replicates). (D and E) Immunofluorescence (D) and quantification (E) of cGAS (red) intracellular localization in HUVECs treated with or without VEGF-A and/or importazole (n = 12 random FOV/group). Scale bar, 20 μm. (F) The expression of cGAS in nuclear and cytoplasmic fractions in HUVECs with or without VEGF-A stimulation (n = 3 replicates). (G) cGAS dephosphorylation in HUVECs treated with or without VEGF-A and/or importazole. (H and I) Representative images (H) and quantification (I) of the distributions of GFP-labeled cGAS or cGAS with NLS-directed mutagenesis in GFP-FLAG-cGAS-ΔNLS or GFP-FLAG-cGAS vector-transfected cGAS KO HUVECs after VEGF-A stimulation (n = 12 random FOV/group). Scale bar, 20 μm. (J and K) Representative images (J) and quantification (K) of cGAS (green) intracellular localization in VEGF-A and/or C-171-treated HUVECs (n = 12 random FOV/group). Scale bar, 20 μm. (L and M) Tube formation (L) and quantification (M) in HUVECs with or without VEGF-A and/or importazole treatment (n = 3 replicates). Scale bar, 200 μm. (N and O) Tube formation (N) and quantification (O) in control vector-, GFP-FLAG-cGAS-ΔNLS-, or GFP-FLAG-cGAS-transfected cGAS KO HUVECs (n = 3 replicates). Scale bar, 200 μm. (P and Q) Relative mRNA levels of CTGF (P) and CYR61 (Q) in cGAS KO and normal HUVECs before and after 6-h VEGF-A treatment (n = 4 replicates). (R) Representative images of cGAS intracellular distributions in HUVECs stably expressing GFP-cGAS (green) with low- (40% confluence) or high-density (80% confluence). Scale bar, 20 μm. (S and T) Immunofluorescence (S) and quantification (T) of cGAS (green) intracellular localization at different developmental stages in SC of zebrafish (n = 5 replicates). Scale bars, 100 μm (lower magnification) and 20 μm (insets). Data are represented as means ± SEM. Student’s t test in (I), ANOVA in (B), (E), (K), (M), (O–Q), and (T). ∗p < 0.05; ∗∗p < 0.01; ∗∗∗p < 0.001; ns, no significant. C, cytosol; N, nucleus. See also Figures S2 and S3. |