|
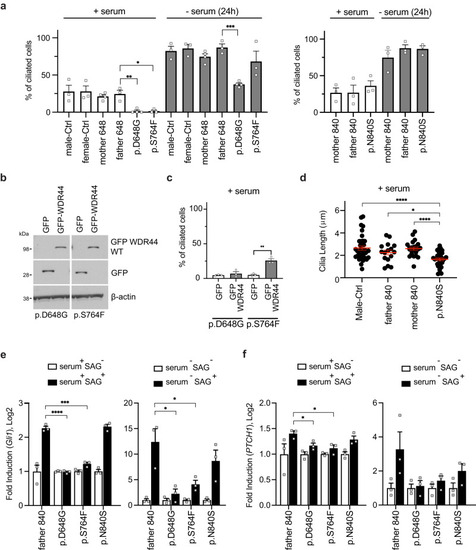
Patient fibroblasts have affected ciliation and Hedgehog signaling. a Quantification of ciliation in control and WDR44 variant (p.D648G, p.S764F, p.N840S) patient fibroblast fed with 10% serum (+serum) or starved (−serum) for 24 h, followed by anti-Arl13b, anti-CEP164, and anti-CP110 antibodies staining. >150 cells were counted from three or more independent experiments. Statistical comparisons with father 648 are shown. +serum: P = 0.012 (p.S764F), 0.0039 (p.D648G), −serum (24 h): P = 0.0001 (p.D648G). b Immunoblotting analysis of GFP or GFP-WDR44 wild-type and β-actin from lysates of patient fibroblasts. Probed for GFP and β-actin antibodies. c Ciliation was quantified in p.D648G and p.S764F patient fibroblast rescued with GFP control or GFP-WDR44 wild-type. >150 cells were counted from three independent experiments. P = 0.0024 (p.S764F). d Quantification of cilia length in fibroblast from p.N840S and controls that were stained as in (a). Statistical comparisons with p.N840S. P = 0.0131 (father 840), <0.0001 (Male-Ctrl, mother 840). (e, f) Hedgehog signaling was analyzed in parental control and patient fibroblasts. GLI1 (e) and PTCH1 (f) transcript fold induction determined by real-time RT-PCR in fibroblast fed with 10% serum (serum+) or starved (serum-) in the presence (SAG+) or absence (SAG-) of SAG for 24 h. Statistical comparisons with father 840 SAG+ are shown. e serum+: P = 0.0001 (p.S764F), <0.0001 (p.D648G), serum-: P = 0.0211 (p.D648G), 0.0375 (p.S764F). f serum+: P = 0.03 (p.D648G), 0.025 (p.S764F). Mean ± s.e.m. from three independent experiments. Unpaired two-tailed t-test; *P < 0.05, **P < 0.01, ***P < 0.001, ****P < 0.0001. Source data are provided as a Source Data file.
|