
FIGURE
Figure 5.
- ID
- ZDB-FIG-240109-28
- Publication
- Pettersen et al., 2024 - Intergenerational plasticity aligns with temperature-dependent selection on offspring metabolic rates
- Other Figures
- All Figure Page
- Back to All Figure Page
Figure 5.
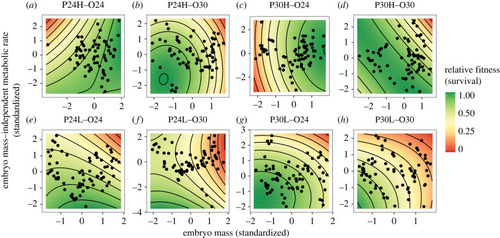
Selection surface plots. Selection on embryo mass (μg) and metabolic rate ( |
Expression Data
Expression Detail
Antibody Labeling
Phenotype Data
Phenotype Detail
Acknowledgments
This image is the copyrighted work of the attributed author or publisher, and
ZFIN has permission only to display this image to its users.
Additional permissions should be obtained from the applicable author or publisher of the image.
Full text @ Phil. Trans. Roy. Soc. Lond., Series B