
- Title
-
Intergenerational plasticity aligns with temperature-dependent selection on offspring metabolic rates
- Authors
- Pettersen, A.K., Metcalfe, N.B., Seebacher, F.
- Source
- Full text @ Phil. Trans. Roy. Soc. Lond., Series B
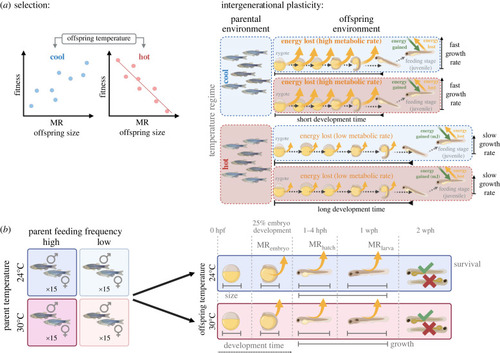
( |
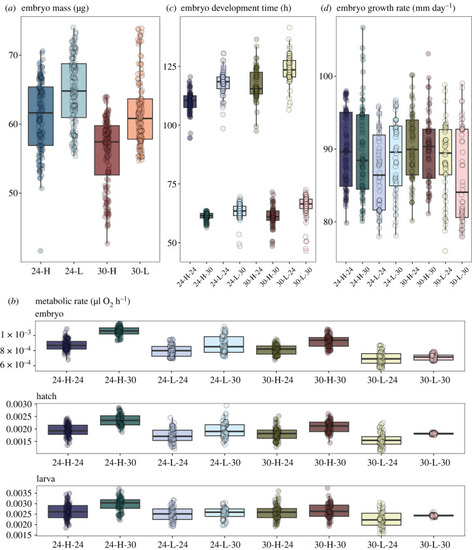
Offspring phenotypes in response to parent and offspring treatments. Responses of ( |
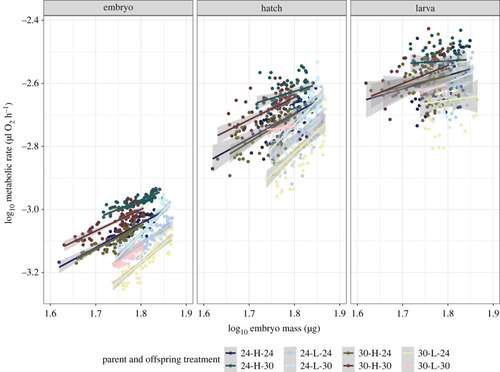
The relationship between offspring metabolic rates (log10 |
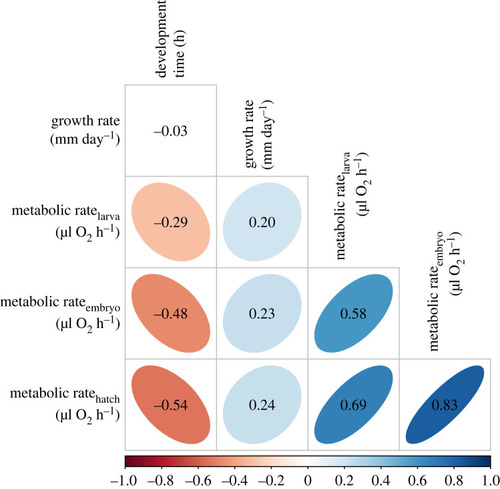
Correlation plots for offspring phenotypes. Pairwise correlations between offspring traits: metabolic rates, embryo development time and larval growth rate, across combinations of parent and offspring treatments. Coloured plots represent significant correlations between traits. |
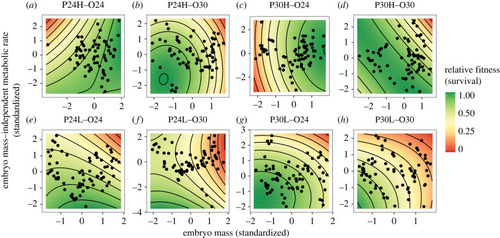
Selection surface plots. Selection on embryo mass (μg) and metabolic rate ( |