
FIGURE
Fig. 5
- ID
- ZDB-FIG-231120-55
- Publication
- Hwang et al., 2023 - Zebrafish thrombosis models according to the location of thrombus formation
- Other Figures
- All Figure Page
- Back to All Figure Page
Fig. 5
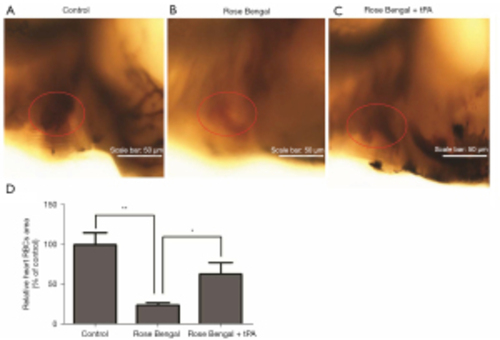
Quantitative assay of intracardiac thrombosis. (A) Control group, (B) Rose Bengal group, (C) Rose Bengal + tPA group, (D) comparison of intracardiac thromboses, red circles indicate thrombus in the zebrafish heart shown by O-dianisidine staining of the red blood cells. *, P<0.05; **, P<0.01. tPA, tissue plasminogen activator. |
Expression Data
Expression Detail
Antibody Labeling
Phenotype Data
| Fish: | |
|---|---|
| Condition: | |
| Observed In: | |
| Stage: | Days 7-13 |
Phenotype Detail
Acknowledgments
This image is the copyrighted work of the attributed author or publisher, and
ZFIN has permission only to display this image to its users.
Additional permissions should be obtained from the applicable author or publisher of the image.
Full text @ Ann Transl Med