
Image
|
Figure Caption
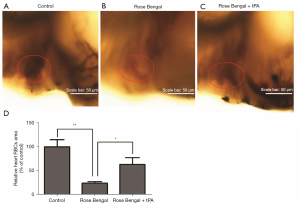
Fig. 5 Quantitative assay of intracardiac thrombosis. (A) Control group, (B) Rose Bengal group, (C) Rose Bengal + tPA group, (D) comparison of intracardiac thromboses, red circles indicate thrombus in the zebrafish heart shown by O-dianisidine staining of the red blood cells. *, P<0.05; **, P<0.01. tPA, tissue plasminogen activator.
Figure Data
Acknowledgments
This image is the copyrighted work of the attributed author or publisher, and
ZFIN has permission only to display this image to its users.
Additional permissions should be obtained from the applicable author or publisher of the image.
Full text @ Ann Transl Med