|
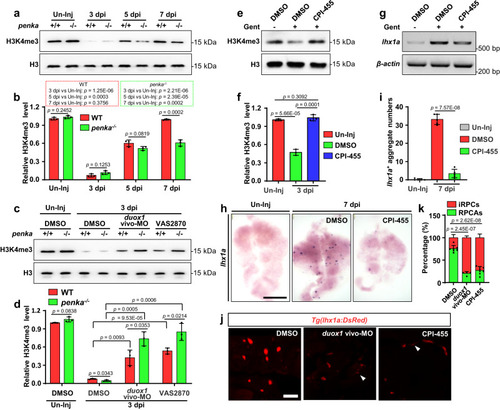
The PENK-A–H2O2 pathway affects the remodeling of global H3K4me3 in kidney cells. a Western blot analysis of H3K4me3 levels in WT and penka−/− zebrafish kidneys following AKI. b The protein band intensities in a were normalized to the loading control, Histone 3 (H3), and the relative expression levels of H3K4me3 were quantified (n = 3 biological replications per group). The data are presented as the fold change relative to the Un-Inj WT group. c Western blot analysis of H3K4me3 levels in WT and penka−/− zebrafish kidneys at 3 dpi after administration (at 2 dpi) of duox1 vivo-MO, VAS2870, or DMSO following AKI. d The protein band intensities in (c) were normalized to the loading control, H3, and the relative expression levels of H3K4me3 were quantified (n = 3 biological replications per group). The data are presented as the fold change relative to the Un-Inj WT group. e Western blot analysis of H3K4me3 levels in the kidneys at 3 dpi after administration (at 2 dpi) of CPI-455 or DMSO following AKI. f The protein band intensities in e were normalized to the loading control, H3, and the relative expression levels of H3K4me3 were quantified (n = 3). The data are presented as the fold change relative to the Un-Inj groups. g, h RT-PCR (g) and WISH (h) analyses of lhx1a at 7 dpi after administration (at 2, 4, and 6 dpi) of CPI-455 or DMSO following AKI (n = 3). i The lhx1a+ RPCAs per kidney (n = 5) were quantified for each condition in (h). j Confocal images showing adult Tg(lhx1a:DsRed) kidneys at 5 dpi after administration (at 2 and 4 dpi) of duox1 vivo-MO (n = 4), CPI-455 (n = 7), or DMSO (n = 8) following AKI. Scale bar, 100 μm. k Quantitation of individual RPCs (iRPCs, arrowheads) and RPCAs in (j). The data in (b), (d), (f), (i), and (k) were analyzed by two-sided t-test and are presented as mean values ± SD. Source data are provided as a Source data file.
|