|
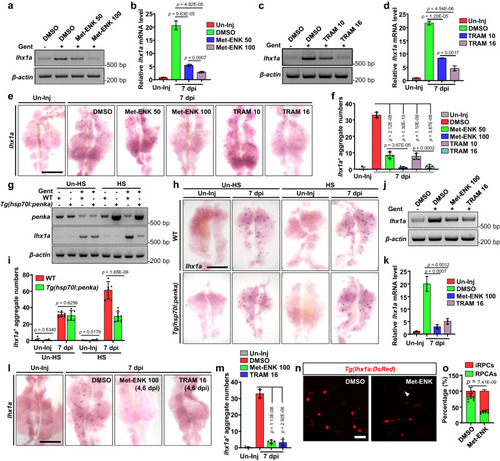
PENK-A acts as a brake in kidney regeneration. a‒e RT-PCR (a, c), qRT-PCR (b, d), and WISH (e) analyses of lhx1a were performed on kidneys administered with Met-ENK (a, b) or TRAM (c, d) at various doses at 7 dpi after AKI (n = 3 in b and d). Met-ENK 50, 50 μM Met-ENK; Met-ENK 100, 100 μM Met-ENK; TRAM 10, 10 μM TRAM; and TRAM 16, 16 μM TRAM. f The lhx1a+ RPCAs per kidney (n = 5) were quantified for each condition in (e). The data in (b) and (d) are presented as the fold change relative to the Un-Inj group. g RT-PCR analysis of penka and lhx1a in WT and Tg(hsp70l:penka) zebrafish kidneys with heat shock (HS) or without HS (Un-HS) in the Un-Inj group or at 7 dpi (n = 3). h WISH analysis of lhx1a in WT and Tg(hsp70l:penka) zebrafish kidneys with HS (n = 6 in WT group, n = 10 in Tg(hsp70l:penka) group) or Un-HS (n = 9 in WT group, n = 6 in Tg(hsp70l:penka) group) in the Un-Inj group or at 7 dpi. i Quantitation of lhx1a+ RPCAs per kidney for each condition in (h). j‒l RT-PCR (j), qRT-PCR (k), and WISH (l) analyses of lhx1a at 7 dpi after administration (at 4 and 6 dpi) of Met-ENK 100 (100 μM Met-ENK, 10 μL per fish) or TRAM 16 (16 μM TRAM, 10 μL per fish) following AKI. The data in (k) (n = 3) are presented as the fold change relative to the Un-Inj group. m The lhx1a+ RPCAs per kidney (n = 5) were quantified for each condition in (l). n Confocal images showing adult Tg(lhx1a:DsRed) kidneys at 5 dpi after administration (at 2 and 4 dpi) of Met-ENK or DMSO following AKI (n = 9). o Quantitation of the individual RPCs (iRPCs, arrowhead) and RPCAs in (n). Data in (b), (d), (f), (i), (k), (m), and (o) were analyzed by two-sided t-test and are presented as mean values ± SD. Scale bars in (e), (h), and (l), 600 μm; (n) 50 μm. Source data are provided as a Source data file.
|