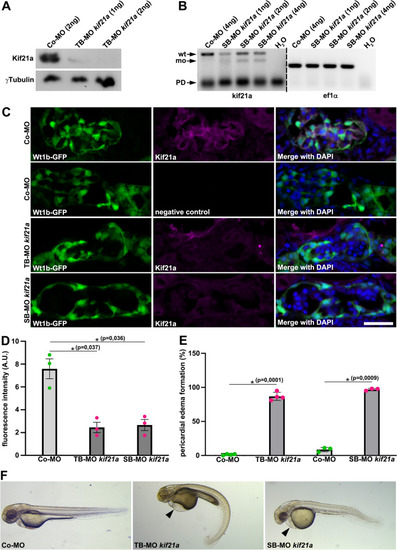
Kif21a deficiency results in pericardial edema formation and reduced glomerular Kif21a signal in zebrafish. (A) Immunoblotting studies on zebrafish lysates of 4dpf old embryos injected with Control (Co)-MO (2 ng) or translation-blocking Morpholino (TB-MO) kif21a (1 or 2 ng) using a specific Kif21a antibody. γTubulin served as loading control. The grouping of blot images cropped from different parts of the same blot image is delineated with a white space. (B) Expression analysis of kif21a using semiquantitative RT-PCR on cDNA of Co-MO (4 ng) or splice-blocking Morpholino (SB-MO) kif21a (1, 2 or 4 ng). Black arrows point to kif21a wildtype (wt) PCR product and morphant (mo) PCR splice product; Primer dimer (PD). H2O served as negative control and ef1α as loading control; dividing lines indicate different contrast from different parts of the same gel image. (C) Glomerular sections of 5dpf old Tg(wt1b:GFP) zebrafish embryos (green) that were injected with Co-MO (6 ng), TB-MO kif21a (2 ng) or SB-MO kif21a (6 ng), immunostained for Kif21a (magenta) and counterstained with DAPI (blue) as a nuclear marker. A respective immunostaining without the secondary antibody of a Co-MO injected embryo served as negative control. Scale bar represents 25 µm. (D) Quantification reveals significant reduced Kif21a levels in the glomerulus of embryos injected with TB-MO kif21a (2 ng) or SB-MO kif21a (6 ng) compared to Co-MO (6 ng) injected embryos; Arbitrary Unit (A.U.). The barchart represents the pooled data from 3 different embryos for each condition. (E) Quantification of pericardial edema formation of 2dpf old zebrafish embryos injected with Co-MO (6 ng), TB-MO kif21a (2 ng) or SB-MO kif21a (6 ng). The barchart represents the pooled data from 3 or 4 independent experiments for each condition, respectively; number (n) of total embryos analysed: Co-MO, n = 390; TB-MO kif21a, n = 384 and Co-MO, n = 290; SB-MO kif21a, n = 290. (F) Bright-field images of zebrafish embryos at 2dpf injected with Co-MO (6 ng), TB-MO kif21a (2 ng) or SB-MO kif21a (6 ng) (black arrowhead points to pericardial edema formation). Unprocessed blot and gel images (A and B, respectively) are presented in Supplementary Fig. S3.
|
