
FIGURE
Fig. 7
Fig. 7
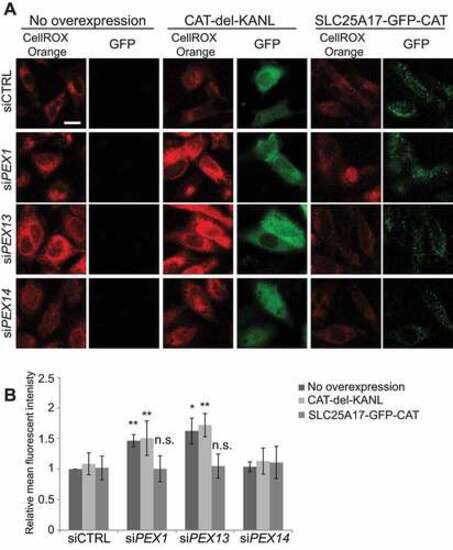
Peroxisome targeted catalase diminishes ROS observed with PEX1 and PEX13 depletion. (A) Live cell images of HeLa cells treated with the indicated siRNA and expressing the indicated CAT constructs and visualized with ROS probe CellROX Orange. (B) Quantification of mean fluorescent intensity of (D) (n = 3; 30 cells/trial). Error bars represent standard deviation. Asterisks denote p-values; *p < 0.05, *p < 0.01. Scale bar: 50 μm. |
Expression Data
Expression Detail
Antibody Labeling
Phenotype Data
Phenotype Detail
Acknowledgments
This image is the copyrighted work of the attributed author or publisher, and
ZFIN has permission only to display this image to its users.
Additional permissions should be obtained from the applicable author or publisher of the image.
Full text @ Autophagy