
Fig. 5
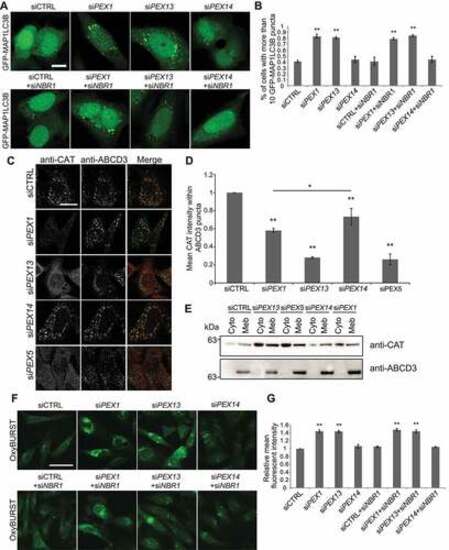
PEX1 and PEX13 depletion induces autophagy, decreases CAT localization to peroxisomes and increases cellular ROS. (A) HeLa cells over-expressing GFP-MAP1LC3B, transfected with siCTRL, siPEX1, siPEX13, siPEX14 alone, or co-transfected with siNBR1. (B) Quantification of images in (A). The number of cells with more than 10 GFP-MAP1LC3B puncta were compared between the siRNA treatments (n = 3; 30 cells/trial). Error bars representing standard deviation. (C) Immunofluorescent images of HeLa cells treated with the indicated siRNAs stained for endogenous catalase (red) and ABCD3 (green). (D) Quantification of mean catalase intensity within ABCD3 structures of images in (A) (n = 3; 30 cells/trial). Error bars represent standard deviation. (E) Membrane fractionation of HEK293 cells treated with indicated siRNA, probed for catalase and ABCD3. Cyto denotes cytosolic fraction, Meb denotes membrane fraction. (F) Live cell images of HeLa cells treated with indicated siRNA and ROS probe OxyBURST. (G) Quantification of mean fluorescent intensity of images in (F) (n = 3; 30 cells/trial). Error bars representing standard deviation. Asterisks denote p-values; *p < 0.05, **p < 0.01. Scale bars: 10 μm (A), 25 μm (C), 50 μm (F). |