
Fig. 6
- ID
- ZDB-FIG-231103-72
- Publication
- Kinoshita et al., 2023 - Acetylcholine potentiates glutamate transmission from the habenula to the interpeduncular nucleus in losers of social conflict
- Other Figures
- All Figure Page
- Back to All Figure Page
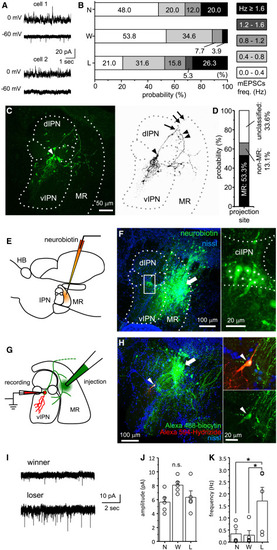
Enhanced synaptic transmission to MR-projecting neurons in the ciIPN of losers (A) Examples of AMPAR-mEPSCs (voltage-clamped at −60 mV) and GABAAR-mIPSCs (voltage-clamped at 0 mV) recorded from two ciIPN neurons. AMPAR-mEPSCs were recorded with extremely low frequency in one neuron (bottom). See also Figure S2A for a comparison of mEPSC amplitude and frequency among naive, winner, and loser groups. Scale bars, 20 pA, 1 s. (B) Relative distributions of neurons in ciIPN of naive (N; n = 25 cells from 15 animals), winner (W; n = 26 cells from 10 animals), and loser (L; n = 18 cells from 8 animals) groups classified with their mEPSC frequency. (C) An example of fluorescent imaging of axonal morphology of an MR-projecting ciIPN neuron (left) and excerpted grayscale imaging (right). One of the axonal branches was toward the MR (double arrowheads) and the other further extended caudally (double arrows). Arrow, branching point of axon; arrowhead, soma. Scale bar, 50 μm. (D) The proportion of ciIPN neurons classified by their axonal projection sites. (E) A schematic diagram showing the relative position of the neurobiotin injection electrode for retrograde labeling from the MR. (F) Retrogradely labeled MR-projecting neurons with neurobiotin in the ciIPN (rectangle), which are magnified on the right panel. Arrow, dye injection site; asterisks, the soma of labeled neurons. Scale bars, 100 μm, 20 μm. (G) A schematic diagram showing the relative positions of the recording electrode and injection sites for retrograde labeling in acute slices. (H) A representative recorded efferent ciIPN neuron. Arrow, injection site; arrowheads, cell body. Scale bars, 100 μm, 20 μm. (I) Representative traces for AMPAR-mEPSCs recorded from MR-projecting ciIPN neurons in winner or loser. Scale bars, 10 pA, 2 s. (J and K) Comparison of AMPAR-mEPSC amplitude (J) and frequency (K) recorded from naive (N, n = 5 cells from 5 animals), winner (W, n = 5 cells from 5 animals), and loser (L, n = 5 cells from 4 animals) groups. Values are presented as mean ± SEM. Statistical significance was defined as ∗p < 0.05; NS, not significant, p ≥ 0.05. See also Figure S3. |