
Fig. 1
- ID
- ZDB-FIG-231103-67
- Publication
- Kinoshita et al., 2023 - Acetylcholine potentiates glutamate transmission from the habenula to the interpeduncular nucleus in losers of social conflict
- Other Figures
- All Figure Page
- Back to All Figure Page
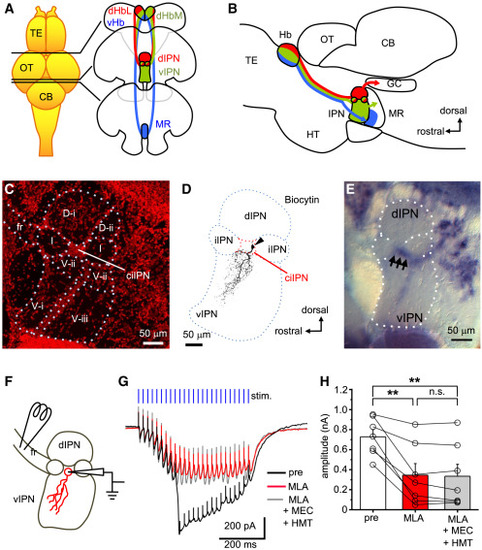
α7 nAChR is expressed in neurons of the v/iIPN and is responsible for the slow current induced by high-frequency stimulation of the fasciculus retroflexus (A) Subnucleus-specific projections from the Hb to the IPN. The dHbL and the dHbM project to the d/iIPN and the v/iIPN, respectively (red and green), and the vHb projects to the MR (blue). (B) A schematic diagram showing the sagittal view of the Hb-IPN pathway and its downstream targets. The dHbL-dIPN pathway sends output to the dorsal tegmental area (red), and the dHbM-vIPN pathway sends output to the MR (green). (C) Subdivisions of the IPN in a sagittal section. Nissl staining shows dorsal subdivisions (D-i and D-ii), ventral subdivisions (V-i, V-ii, and V-iii), and a cell-body area (center of the iIPN [ciIPN]). fr, fasciculus retroflexus. Scale bar, 50 μm. (D) Biocytin labeling of dendritic arborization of a representative ciIPN neuron (arrowhead). Scale bar, 50 μm. (E) Expression of α7 nAChR mRNA in the IPN. Arrows indicate dense signals detected in the ciIPN. Scale bar, 50 μm. (F) Relative positions of the recording and stimulating electrodes for the recording of ACh-mediated currents from ciIPN neurons. Electrical stimulation was applied to the fasciculus retroflexus (fr). (G) Representative traces of a recorded slow wave from a naive ciIPN neuron evoked by repetitive stimulations (blue vertical bars, 0.5 s, 50 Hz) before drug application (black), after bath application of the α7 nAChR antagonist, MLA (50 nM) (red), and in further addition of mecamylamine (MEC) and hexamethonium (HMT) (gray). Scale bars, 200 pA, 200 ms. (H) Comparison of peak amplitude before drug application, in the presence of MLA, and following the addition of MEC and HMT (n = 7 cells from 7 animals). CB, cerebellum; GC, griseum centrale; Hb, habenula; HT, hypothalamus; IPN, interpeduncular nucleus; OT, optic tectum; MR, median raphe; TE, telencephalon. Values are presented as mean ± SEM. Statistical significance was defined as ∗p < 0.05; ∗∗p < 0.01; NS, not significant, p ≥ 0.05. |