|
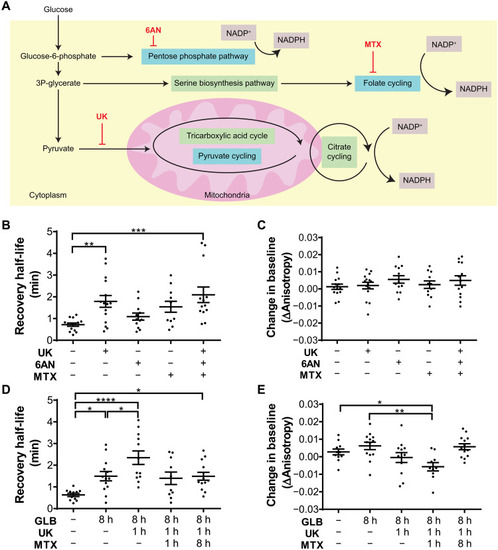
Selective inhibition of NADP+ reduction pathways in unstressed and stressed pancreatic β cells of 5-dpf zebrafish embryos. (A) Diagram of NADP+ reduction pathways, indicated with blue shading, and associated chemical inhibitors, indicated with red text. Connected pathways are indicated with green shading, and mitochondria are indicated with pink shading. (B) NADPH recovery half-life after diamide removal, quantified from in vivo time series fluorescence anisotropy imaging of islet slices from 5-dpf Apollo-NADP+ transgenic zebrafish embryos. UK (200 μM) was used to inhibit pyruvate cycling, 6AN (50 μM) was used to inhibit pentose phosphate pathway, and MTX (50 μM) was used to inhibit folate cycling. Chemical inhibitors were added 1 hour before imaging. (C) Change in baseline anisotropy, quantified from in vivo time series fluorescence anisotropy imaging of islet slices from 5-dpf Apollo-NADP+ transgenic zebrafish embryos. (D) NADPH recovery half-life after diamide removal, quantified from in vivo time series fluorescence anisotropy imaging of islet slices from 5-dpf Apollo-NADP+ transgenic zebrafish embryos. Stress was induced by 8 hours of treatment with 20 μM GLB. (E) Change in baseline anisotropy, quantified from in vivo time series fluorescence anisotropy imaging of islet slices from 5-dpf Apollo-NADP+ transgenic zebrafish embryos. n = 10 to 15 embryos. *P < 0.05, **P < 0.01, ***P < 0.001, and ****P < 0.0001.
|