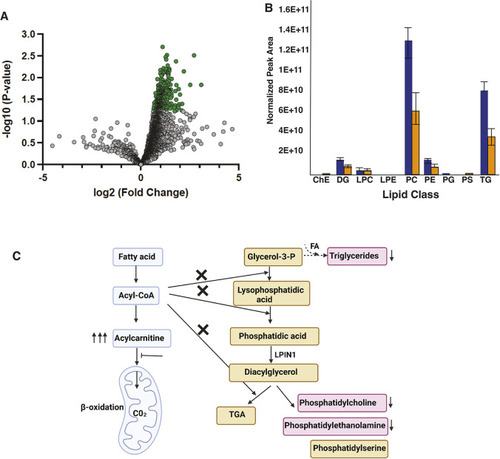
Changes in lipid composition in Tango2 deficiency. (A) Volcano plot of lipid log2(fold change) values in controls versus tango2 mutants (4 weeks). Fold differences are calculated as the ratio of lipids in WT to those in tango2 mutants. Dots in green represent the lipids with the lowest levels in tango2 mutants in comparison to controls (P<0.05). (B) Normalized profiles of different lipids classes (blue, control; orange, tango2 mutants). ChE, cholesterol ester; DG, diglyceride; LPC, lysophosphatidylcholine; LPE, lysophosphatidylethanolamine; PC, phosphatidylcholine; PE, phosphatidylethanolamine; PG, phosphatidylglycerol; PS, phosphatidylserine; TG, triglyceride. Data show the mean±s.e.m. Unpaired two-tailed t-test was used to determine significance. *P<0.05. (C) Working model of the effect of Tango2 deficiency on lipid metabolism: tango2 mutants exhibit a decreased abundance of phospholipids and triglycerides (pink) indicating a defect in the glycerol-3-P pathway. The protein product of LPIN1, a rhabdomyolysis-causing gene, catalyzes diacylglycerol synthesis in the glycerol-3-P pathway. Triglycerides are energy stores synthesized using glycerol-3-phosphate and fatty acids (FA) and are reduced in Tango2 deficiency. Some patients' fibroblasts exhibit acylcarnitine accumulation, which may limit acyl-CoA availability for the glycerol-3-P pathway, resulting in phospholipid deficiency. TGA: Triacylglycerol.
|
