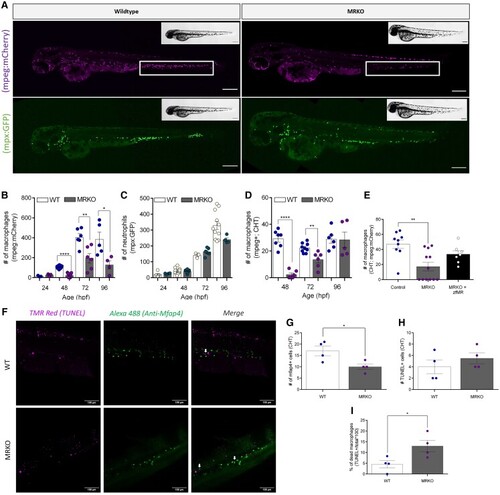
A loss of MR results in global macrophage depletion throughout development. (A) Representative images of either Tg(mpeg:mCherry/mpx:eGFP);nr3c2+/+ (WT) or Tg(mpeg:mCherry/mpx:eGFP);nr3c2inr11/inr11 (MRKO), at 48 hours postfertilization (hpf). The macrophages are visualized by the mCherry signal (magenta) and the neutrophils by the GFP signal (green). Scale bar: 200 µm. (B) The number of mpeg+ macrophages in the whole body (excluding the yolk) at 24, 48, 72, and 96 hpf (n = 5-15). (C) The number of mpx+ neutrophils in the whole body (excluding the yolk) at 24, 48, 72, and 96 hpf (n = 5-15). (D) The number of macrophages (mpeg+ cells) in the caudal hemopoietic tissue (CHT) of larvae at 48 hours postfertilization (hpf) (n = 5-9). (E) The number of mpeg+ macrophages in the caudal hemopoietic tissue (CHT) region of WT, MRKO, and MRKO injected with a zfMR expression vector at 48 hpf (n = 9-12). (F) Representative images of the zebrafish CHT stained with TMR-Red (magenta; TUNEL, cell death), Alexa 488 (green; anti-Mfap4, macrophages) and a merged image of TUNEL and Mfap4 signals (white arrows denote colocalization). (G) The number of Mfap4-positive cells in the CHT. (H) The number of TUNEL-positive cells in the CHT. (I) The percentage of TUNEL-positive macrophages in the CHT. Bars show mean ± SEM of data pooled from 3 different experiments (B-E, G-I; each data point representing a single embryo/larva). Data were analyzed using a 2-way ANOVA (B-D; Holm-Sidak post hoc test), a 1-way ANOVA (E), or a t-test (G-I). Statistical significance is indicated by *P ≤ .05, **P ≤ .01, ***P ≤ .001, ****P ≤ .0001.
|
