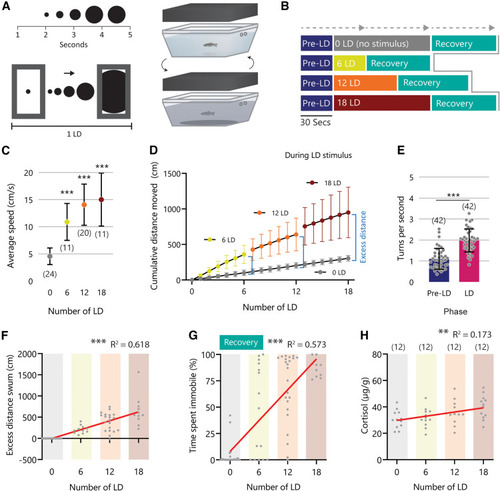
The LD stimulus presentation allows delivery of graded acute stress exposure. A, The LD stimulus is presented on a monitor above the fish and each LD event lasts 4.8 s. B, The LD is presented after a 30-s pre-LD phase and is then repeated 6, 12, or 18 times. A 30-s recovery phase is subsequently recorded. C, The average speed during the LD phase for each intensity (cm/s). D, Cumulative distance swum (cm) during the LD presentation for all LD groups. Excess distance (cm) is the δ between 0 LD and the cumulative distance at each LD number (6, 12, 18). E, The number of turns (turns per second) during the first 6 LD in the 6LD, 12 LD, and 18 LD group compared with the pre-LD phase. F, Correlation between excess distance swum (cm) and the number of LD presented. G, Correlation between time spent immobile (%) for the 60-s post-LD exposure and the number of LD presented. H, Correlation between whole-body cortisol (μg/g) measured 15 min after LD exposure and the number of LD presented. Extended Data Figures 3-1 and 3-2 are available to support this figure. Error bars denote the mean ± 1 standard deviation (SD); significant post hoc comparisons and slope significance, **P < 0.01; ***P < 0.001. Abbreviations: LD, looming dot.
|
