
FIGURE
Fig. 4
- ID
- ZDB-FIG-230915-12
- Publication
- Wang et al., 2023 - Synergistic anti-cancer and attenuation effects of thymosin on chemotherapeutic drug vinorelbine in tumor-bearing zebrafish
- Other Figures
- All Figure Page
- Back to All Figure Page
Fig. 4
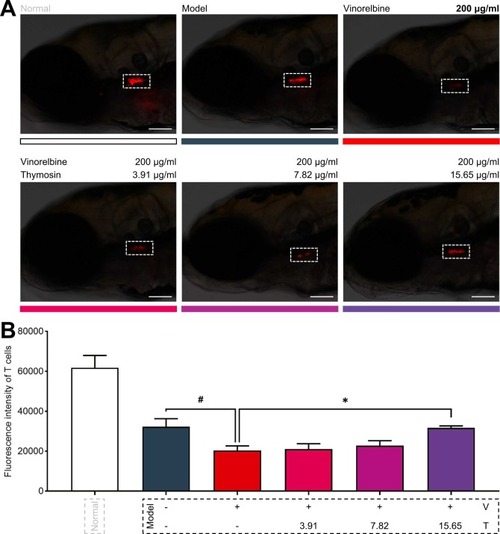
Fig. 4. Thymosin suppresses vinorelbine-induced T cell decrease in the xenotransplanted zebrafish model (Tg:rag2-DsRed). (A) Representative images of xenotransplanted zebrafish in different groups. The dotted box indicates the thymus where T cells gather. Scale bar, 100 µm. (B) Fluorescence intensity of T cells after treatment of vinorelbine and thymosin for 18 h. Data are expressed as mean ± SEM. n = 10. ∗P < 0.005 compared to the vinorelbine treatment group; #P < 0.05, comparison between the model control group and the vinorelbine treatment group. Abbreviations: T: thymosin; V: vinorelbine. |
Expression Data
Expression Detail
Antibody Labeling
Phenotype Data
Phenotype Detail
Acknowledgments
This image is the copyrighted work of the attributed author or publisher, and
ZFIN has permission only to display this image to its users.
Additional permissions should be obtained from the applicable author or publisher of the image.
Full text @ Biomed. Pharmacother.