
Fig. 4
- ID
- ZDB-FIG-230912-25
- Publication
- Abu Bakar et al., 2023 - Embryonic mercury exposure in zebrafish: Alteration of metabolites and gene expression, related to visual and behavioral impairments
- Other Figures
- All Figure Page
- Back to All Figure Page
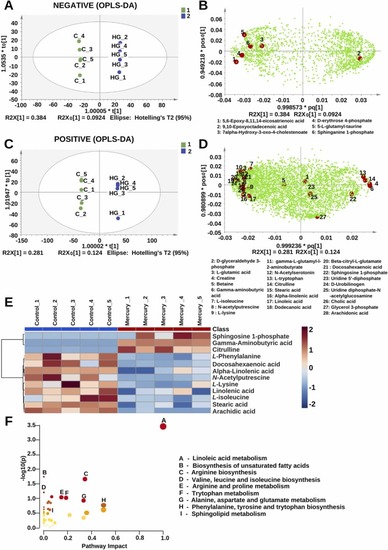
Fig. 4. OPLS–DA. (A–D) Score plot and loading scatter plot of positive and negative modes in reference to normalized data of the zebrafish larvae exposed to 100 nM HgCl2 compared to control. (E) Hierarchical clustering using log2 fold change value generate heatmap of the top 25 downregulated (blue) and upregulated (red) metabolites from the positive and negative ion modes after embryonic exposure to HgCl2 compared to control (F) Targeted enrichment analysis obtained from –log of p–values and pathway impact values via the topology analysis lists potential signaling pathways dysregulated (yellow < orange < red – increasing statistical significance, circle diameter – pathway impact) after embryonic exposure to HgCl2. |