
Fig. 7
- ID
- ZDB-FIG-230830-1
- Publication
- Weinschutz Mendes et al., 2023 - High-throughput functional analysis of autism genes in zebrafish identifies convergence in dopaminergic and neuroimmune pathways
- Other Figures
- All Figure Page
- Back to All Figure Page
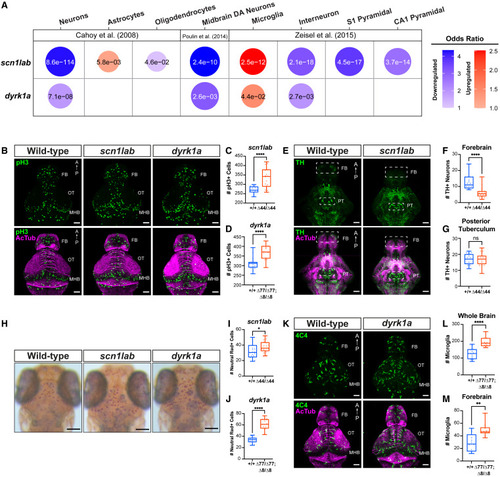
Dopaminergic and microglial phenotypes in scn1lab and dyrk1a mutants (A) Hypothesis-driven GSEA of DE genes (p < 0.1 and fold-change >1.5) in scn1labΔ44/Δ44 and dyrk1aaΔ77/Δ77dyrk1abΔ8/Δ8 mutants using cell-type-specific datasets.58,59,60 Cell type markers enriched in upregulated (red) or downregulated (blue) genes are shown. Bubbles are shown only for cell type markers with significant enrichment (p < 0.05). The color intensity and size of each bubble represent the odds ratio. p-values calculated using Fisher’s exact test are shown in each bubble. For the complete GSEA in homozygotes and heterozygotes, see Figure S7A. (B) Phospho-histone H3 (pH3, green) and acetylated tubulin (AcTub, magenta) immunostained whole brains of scn1labΔ44/Δ44 and dyrk1aaΔ77/Δ77dyrk1abΔ8/Δ8 versus wild-type fish at 3 dpf. Dorsal views. FB, forebrain; OT, optic tectum; MHB, midbrain-hindbrain boundary. Scale bar, 50 μm. For quantification by brain region, see Figures S7B–S7E. (C and D) Total number of pH3+ cells in scn1labΔ44/Δ44 (n = 18) versus scn1lab+/+ (n = 16) (C) and dyrk1aaΔ77/Δ77dyrk1abΔ8/Δ8 (n = 14) versus wild-type fish (n = 19) (D). ∗∗∗∗p < 0.0001, one-way ANOVA. (E) Tyrosine hydroxylase (TH, green) and acetylated tubulin (AcTub, magenta) immunostained whole brains of wild-type, scn1labΔ44/Δ44, and dyrk1aaΔ77/Δ77dyrk1abΔ8/Δ8 fish at 4 dpf. Scale bar, 50 μm. Ventral views. FB, forebrain; PT, posterior tuberculum. (F and G) Total number of TH+ cells in scn1labΔ44/Δ44 (n = 20) versus scn1lab+/+ (n = 19) in the forebrain (F) and posterior tuberculum (G) (boxes in [E]). ∗∗∗∗p < 0.0001, one-way ANOVA. For heterozygous phenotypes, see Figures S7F–S7G. (H) Neutral red staining of live scn1labΔ44/Δ44 and dyrk1aaΔ77/Δ77dyrk1abΔ8/Δ8 versus wild-type fish at 4 dpf. Scale bar, 0.1 mm. (I and J) Total number of neutral red+ cells in scn1labΔ44/Δ44 (n = 17) versus scn1lab+/+ (n = 20) (I) and dyrk1aaΔ77/Δ77dyrk1abΔ8/Δ8 (n = 16) versus wild-type fish (n = 15) (J). ∗∗∗∗p < 0.0001, ∗p < 0.05, one-way ANOVA. (K) 4C4 (green) and acetylated tubulin (AcTub, magenta) immunostaining of whole brains of dyrk1aaΔ77/Δ77dyrk1abΔ8/Δ8 and wild-type fish at 4 dpf. Scale bar, 50 μm. Dorsal views. FB, forebrain; OT, optic tectum; MHB, midbrain-hindbrain boundary. (L and M) Total number of 4C4+ cells in dyrk1aaΔ77/Δ77dyrk1abΔ8/Δ8 (n = 13) versus wild-type (n = 10) in whole brain (L) and forebrain (M). ∗∗∗∗p < 0.0001, ∗∗p < 0.01, one-way ANOVA. |