|
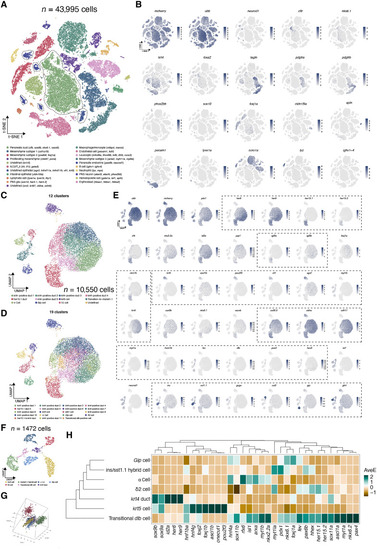
Single-cell transcriptomics highlight distinct molecular signatures in various cell types. (A) t-distributed stochastic neighbor embedding (t-SNE) plot showing the cell type assignment of all single cells (~40,000). The classifications were based on previously known marker genes that were significantly enriched in each cluster (highlighted in parentheses). TH2, T helper 2 cells; ILC2, innate lymphoid cells type 2. (B) t-SNE plots of well annotated cell markers, colored by the normalized gene expression levels. (C and D) UMAP plot of subclustering including pancreatic duct, krt5+ cells, and endocrine cells (~10,000). (E) UMAP plots of various marker genes, colored by the normalized gene expression levels. (F and G) UMAP plot and 3D PCA plot showing the embedding of krt5+ cell and all endocrine cells. (H) Heatmap highlighting the key lineage-committed transcription factors and hormones in each cluster, with colors displayed on column-scaled mean expression. The rows and clusters were ordered by hierarchical clustering of scaled expression values.
|