IMAGE

Fig. 6.

ID
ZDB-IMAGE-230823-21
Source
Figures for Mi et al., 2023
Image
Figure Caption

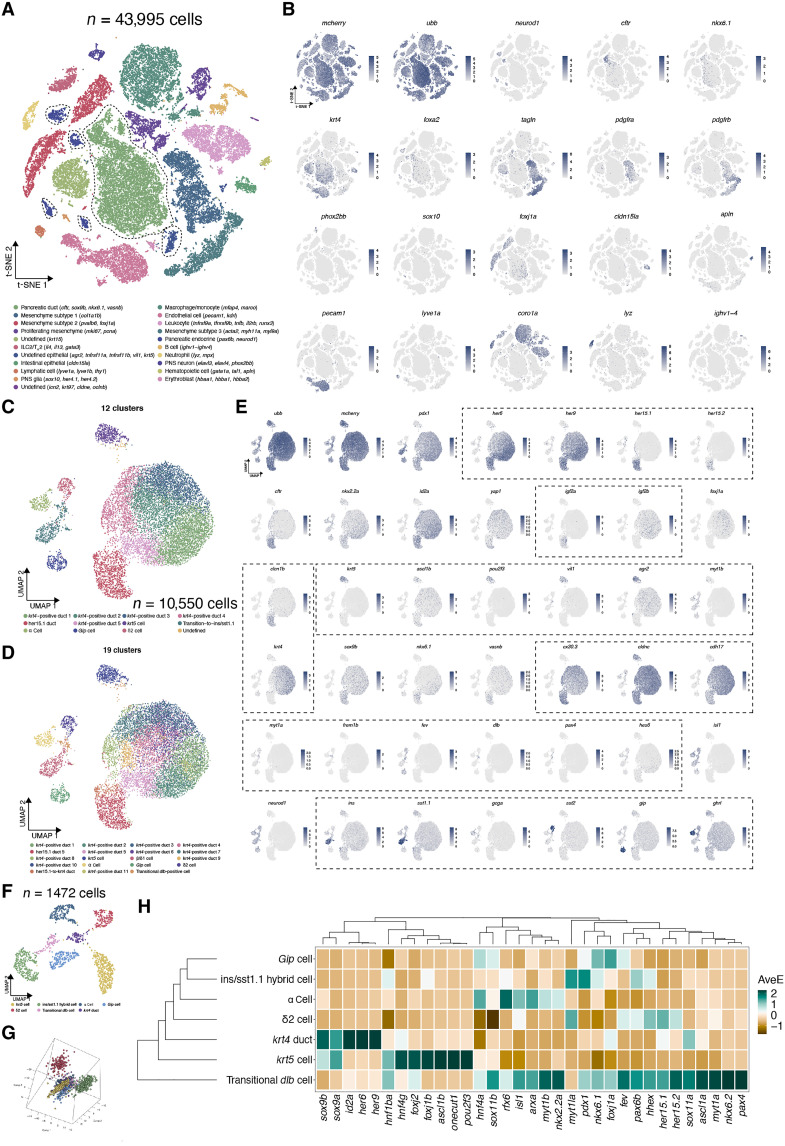
Fig. 6. Single-cell transcriptomics highlight distinct molecular signatures in various cell types.

(A) t-distributed stochastic neighbor embedding (t-SNE) plot showing the cell type assignment of all single cells (~40,000). The classifications were based on previously known marker genes that were significantly enriched in each cluster (highlighted in parentheses). TH2, T helper 2 cells; ILC2, innate lymphoid cells type 2. (B) t-SNE plots of well annotated cell markers, colored by the normalized gene expression levels. (C and D) UMAP plot of subclustering including pancreatic duct, krt5+ cells, and endocrine cells (~10,000). (E) UMAP plots of various marker genes, colored by the normalized gene expression levels. (F and G) UMAP plot and 3D PCA plot showing the embedding of krt5+ cell and all endocrine cells. (H) Heatmap highlighting the key lineage-committed transcription factors and hormones in each cluster, with colors displayed on column-scaled mean expression. The rows and clusters were ordered by hierarchical clustering of scaled expression values.

Acknowledgments
This image is the copyrighted work of the attributed author or publisher, and ZFIN has permission only to display this image to its users. Additional permissions should be obtained from the applicable author or publisher of the image. Full text @ Sci Adv