|
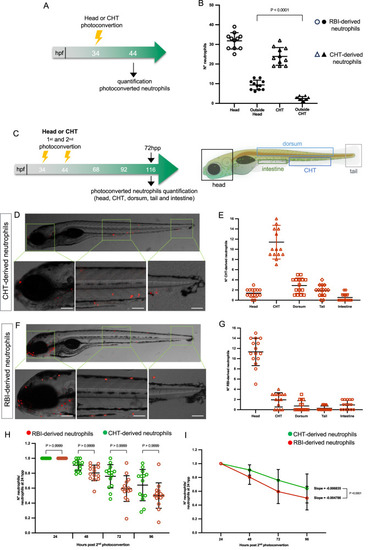
Migration capacity, tissue deployment and lifespan of RBI-derived and CHT-derived neutrophils during homeostasis. A Experimental strategy design. At 34 h post fertilization (hpf) the head or the CHT was photoconverted and at 44 hpf the number of RBI-derived and CHT-derived neutrophils located in or outside the corresponding original region, was quantified. B Quantification of the number of RBI-derived and CHT-derived neutrophils present in and outside the head or CHT, n = 11 embryos for head or CHT photoconvertion per experiment. C Experimental design. At 34 hpf and 44 hpf the first and second photoconversion were performed either in the head or CHT according to the experimental needs. D, E Representative images and quantification of CHT-derived neutrophils at 72 h post second photoconversion (hpp) present in the head, CHT, dorsum, tail, and intestine. n = 15 larvae for head or CHT photoconvertion per experiment. F, G Representative images and quantification of RBI-neutrophils at 72 hpp present in the head, CHT, dorsum, tail, and intestine, n = 15 larvae for head or CHT photoconvertion. H Quantification of photoconverted RBI and CHT-derived neutrophils present in the whole body compared to their initial number (24 hpp), n = 14 larvae for head or CHT photoconvertion per experiment. I Loss rate of RBI-derived (red line) and CHT-derived neutrophils (green line) during 72 h. n = 14 larvae for head or CHT photoconvertion per experiment. Data are represented as mean ± SD. Statistical analyses were performed using a two-sided Mann-Whitney U test. Experiments were performed independently at least 3 times. Scale bar: 100 μm.
|