IMAGE

Fig. 1

ID
ZDB-IMAGE-230817-15
Source
Figures for García-López et al., 2023
Image
Figure Caption

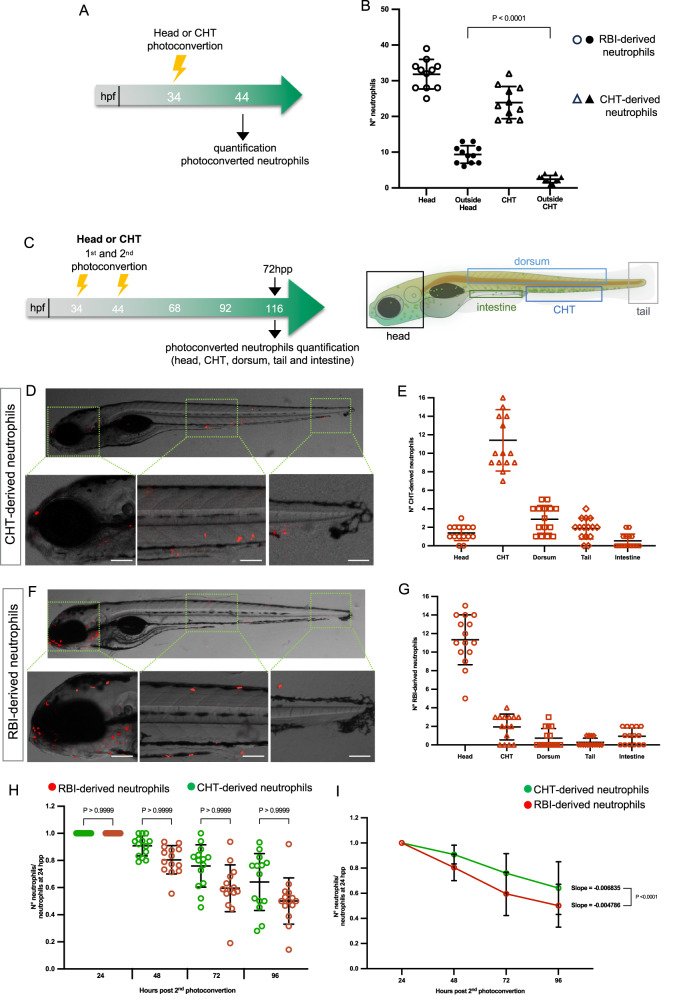
Fig. 1 Migration capacity, tissue deployment and lifespan of RBI-derived and CHT-derived neutrophils during homeostasis.

A Experimental strategy design. At 34 h post fertilization (hpf) the head or the CHT was photoconverted and at 44 hpf the number of RBI-derived and CHT-derived neutrophils located in or outside the corresponding original region, was quantified. B Quantification of the number of RBI-derived and CHT-derived neutrophils present in and outside the head or CHT, n = 11 embryos for head or CHT photoconvertion per experiment. C Experimental design. At 34 hpf and 44 hpf the first and second photoconversion were performed either in the head or CHT according to the experimental needs. D, E Representative images and quantification of CHT-derived neutrophils at 72 h post second photoconversion (hpp) present in the head, CHT, dorsum, tail, and intestine. n = 15 larvae for head or CHT photoconvertion per experiment. F, G Representative images and quantification of RBI-neutrophils at 72 hpp present in the head, CHT, dorsum, tail, and intestine, n = 15 larvae for head or CHT photoconvertion. H Quantification of photoconverted RBI and CHT-derived neutrophils present in the whole body compared to their initial number (24 hpp), n = 14 larvae for head or CHT photoconvertion per experiment. I Loss rate of RBI-derived (red line) and CHT-derived neutrophils (green line) during 72 h. n = 14 larvae for head or CHT photoconvertion per experiment. Data are represented as mean ± SD. Statistical analyses were performed using a two-sided Mann-Whitney U test. Experiments were performed independently at least 3 times. Scale bar: 100 μm.

Acknowledgments
This image is the copyrighted work of the attributed author or publisher, and ZFIN has permission only to display this image to its users. Additional permissions should be obtained from the applicable author or publisher of the image. Full text @ Nat. Commun.